TL;DR: Parents of 181 children in Poland, 85 of them autistic, described everything their child ate over 1 day, and researchers counted how many of 9 food groups each child's meals covered. The researchers found no clear overall difference in the number of food groups eaten: they were more likely than other children to eat from very few food groups, but also more likely to eat from a very wide range.
Key Findings
- No clear overall gap: The median was 6 of 9 food groups for autistic children and 5 for other children that day. That difference wasn't statistically clear.
- More very narrow diets: 33% of autistic children ate from 4 or fewer food groups, vs 16% of other children.
- More very varied diets too: 34% of autistic children ate from 7 or more food groups, vs 20% of other children.
- Different foods: Autistic children more often ate beans, lentils, nuts or seeds, while other children more often ate dark green leafy vegetables.
- Texture and temperature were linked to variety: Some food preferences differed by variety band in exploratory comparisons.
Source: Nutrients (2026) | Grot-Nigowska, Kowalski and Białek-Dratwa
Picky eating is one of the most familiar struggles for parents of autistic children. Many autistic kids react strongly to how food feels, smells or looks, and some will only eat a handful of foods.
That has led to a common assumption that autistic children, as a group, eat a less varied diet. A study from Poland suggests the picture is more mixed.
How Was Diet Measured?
A 2026 study in Nutrients, by dietitians at the Medical University of Silesia in Katowice, compared 2 groups of children aged 2 to 10:
- Autistic children: 85 children with a confirmed autism diagnosis, seen at a center for children with developmental conditions
- Comparison children: 96 children without a diagnosed neurodevelopmental disorder, recruited through randomly selected daycares, preschools and schools in the same region
A parent described everything their child ate and drank over the previous 24 hours. Researchers sorted those foods into 9 groups, such as grains, dark green leafy vegetables, fruits, meat and fish, eggs, dairy, and beans, lentils, nuts and seeds.
Each child got a diet variety score: the number of food groups they ate from that day, from 0 to 9. Scores were grouped as:
- Narrow: 4 or fewer food groups
- Middle: 5 or 6 food groups
- Wide: 7 or more food groups
These bands describe the study's one-day food count. They aren't clinical cutoffs for nutrition or feeding difficulties.
Parents also answered questions about feeding difficulties and about which textures, temperatures and appearances of food their child would accept.
Did Autistic Children Eat Less Varied Diets?
The one-day recall showed no statistically clear overall difference. The median was 6 food groups for autistic children and 5 for comparison children.
After accounting for age, sex and body mass index (BMI), the autistic group averaged about 1 more food group in the model.
The middle scores hid a bigger story. Autistic children were spread out toward both ends of the scale, while most comparison children sat in the middle.
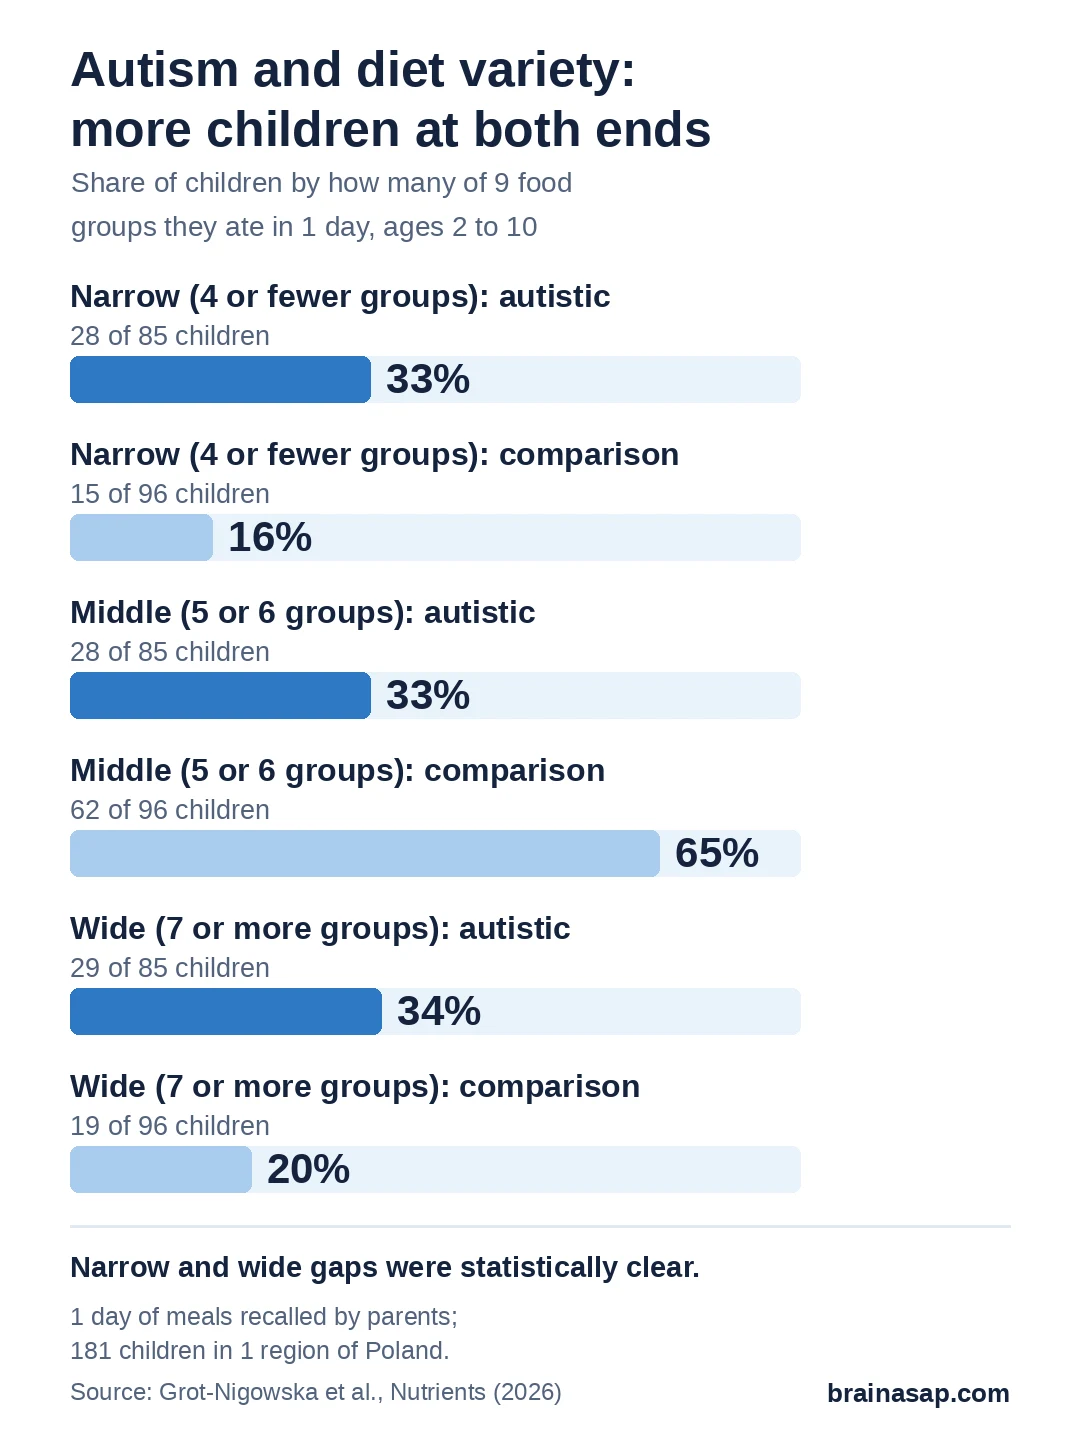
- Narrow diets: 33% of autistic children vs 16% of comparison children
- Middle diets: 33% vs 65%
- Wide diets: 34% vs 20%
Both the narrow and wide differences were statistically clear.
Which Foods Differed?
Some food groups showed sharp differences on the day recorded:
- Beans, lentils, nuts or seeds: eaten by 45% of autistic children vs 4% of comparison children
- Dairy: 95% vs 83%
- Dark green leafy vegetables: eaten more often by comparison children
Meat and fish were nearly universal in both groups, at about 95%.
Did Feeding Problems and Senses Play a Role?
Feeding difficulties were also split. More autistic children had no feeding difficulty at all (22% vs 2%), but more also had the most severe level of difficulty (21% vs 7%).
Sensory preferences went along with diet variety. Autistic children more often would eat a meal only if it was at a particular temperature, and acceptance of certain textures, such as firm foods without lumps, differed by diet variety band.
These sensory analyses were exploratory, and the study didn't correct for running many comparisons, so they are best read as clues rather than firm findings.
What Are the Limits?
- Just 1 day: A single day of meals may not reflect what a child usually eats
- Parent reports: Everything was recalled by parents, not observed
- Uneven groups: Autistic children were mostly boys (67%), while comparison children were mostly girls (58%)
- Different recruitment: Autistic children came from a developmental center and comparison children from schools and daycares, by convenience
- Variety is not quality: Eating from many food groups doesn't show whether a child got enough of each nutrient
- Small, regional sample: 181 children from 1 region of Poland
What Does This Mean for Families?
The study doesn't support assuming that all autistic children eat from a narrow range of food groups. About 1 in 3 ate a very narrow range of foods that day, but another 1 in 3 ate a wider range than most of their peers.
Grot-Nigowska and colleagues concluded that each autistic child's eating, including sensory dislikes around texture and temperature, should be assessed individually rather than treated as a single autism-wide problem. Whether the 2 extremes reflect stable eating patterns, rather than 1 unusual day, would need repeated food records to show.
Citation: DOI: 10.3390/nu18183061 · Grot-Nigowska M, Kowalski O, Białek-Dratwa A. Dietary Diversity in Children with Autism Spectrum Disorders, Feeding Difficulties, and Sensory Issues Related to Eating—A Case–Control Study. Nutrients. 2026;18:3061.
Study Design: Clinical case-control study with a single 24-hour dietary recall (Dietary Diversity Score, 9 food groups) and parent questionnaires on feeding difficulties and sensory acceptance.
Sample Size: 181 children aged 2 to 10 years (85 with autism spectrum disorder, 96 controls).
Key Statistic: Median DDS 6 vs 5 (p = 0.172); adjusted β = 1.07 (95% CI 0.44 to 1.70) for ASD; low DDS 32.9% vs 15.6% (OR 2.63, 95% CI 1.30 to 5.56); high DDS 34.1% vs 19.8% (OR 2.08, 95% CI 1.08 to 4.17).
Caveat: Single 24-hour recall, parent report, convenience sampling, sex imbalance between groups; no correction for multiple comparisons in exploratory analyses.