TL;DR: In a driving simulator, 30 drivers felt more strained and tired in rain, snow or fog than in clear weather. Each kind of bad weather showed up differently, with drivers slowing down most in fog.
Key Findings
- Workload up in all bad weather: Scores rose 11 to 14 points on an 80-point scale compared with clear weather.
- Frustration roughly doubled: Biggest jump of any workload measure.
- Fog meant slower, steadier driving: Lower speed and smoother control.
- Rain raised heart rate most.
- Snow made drivers least predictable: Drivers coped in the most varied ways.
Source: Frontiers in Neuroscience (2026) | Tian et al.
Most drivers know that a heavy downpour or a whiteout feels harder than a dry, sunny road. But is rain just a milder version of snow, or does each kind of weather wear on a driver in its own way?
Researchers at Xinjiang University in China put drivers through all three in a simulator while tracking their brain waves, heart rate and every move of the wheel and pedals.
Four Six-Minute Drives in Different Weather
Thirty licensed drivers (20 men, 10 women, aged 20 to 45) drove a simulated city road with a 60 km/h speed limit and the same traffic each time. Only the weather changed:
- Clear (the comparison)
- Heavy rain and dense fog, with visibility of 200 to 500 meters
- Heavy snow, with visibility under 500 meters
Each drive lasted 6 minutes, in a shuffled order. After each one, drivers rated their workload on the NASA Task Load Index (mental demand, time pressure, effort and frustration, scored 0 to 80) and their sleepiness on a 1 to 9 scale. Throughout, they wore an 8-channel EEG cap and a heart-monitor vest.
Every Kind of Bad Weather Felt Harder
Compared with clear weather, workload scores rose in all three bad-weather drives:
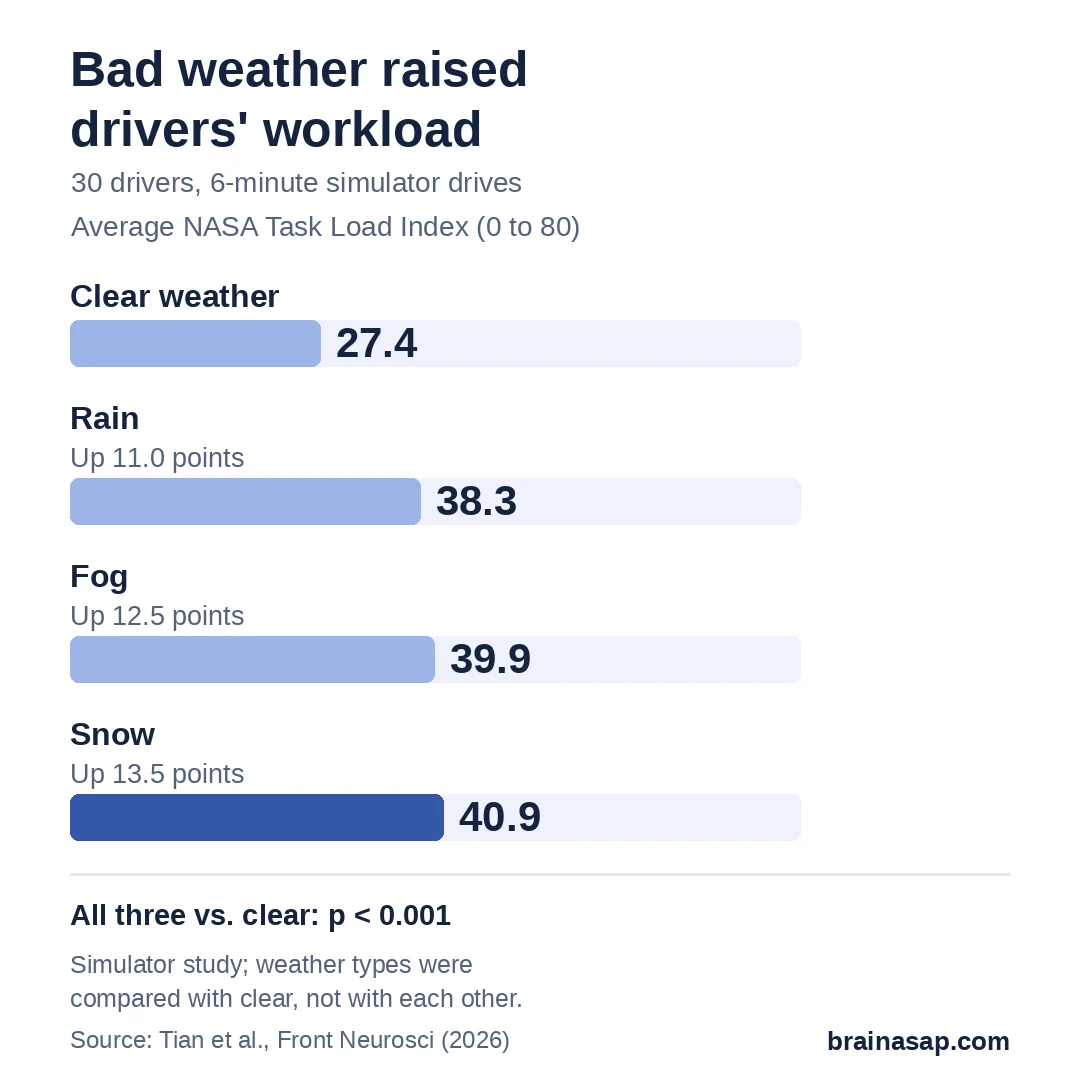
- Snow: Up 13.5 points
- Fog: Up 12.5 points
- Rain: Up 11 points
Frustration showed the biggest change, rising from about 4 points in clear weather to about 8 in each kind of bad weather. Sleepiness also rose, most in rain and snow, though average scores stayed on the alert side of the scale (about 3.5 out of 9).
Fog Made Drivers Slow Down and Steady Up
Behind the wheel, the three conditions split apart. In fog, drivers dropped their average speed the most and made smaller, steadier speed and steering changes. The researchers describe this as playing it safe to make up for what drivers could not see.
Rain looked different. Heart rate rose the most in rain, and brain-wave activity shifted the most, while driving control stayed about as steady as in clear weather.
In all three bad-weather drives, cars drifted further from the lane center than in clear weather.
Snow Pushed Drivers in Different Directions
Snow stood out in a less obvious way. The team trained a computer model to guess the weather from each 10-second slice of a driver's data. It got 91.9% right overall, but it was least sure of itself during snow.
That uncertainty reflects drivers coping with snow in very different ways from each other. Variation in speed control between drivers was about twice as large in snow as in clear weather. Brain-wave complexity also rose in snow, across most of the head.
A Short Simulator Test Has Limits
- Simulator, not real roads: No real risk, cold or slippery tires.
- Short drives: 6 minutes per weather type.
- Fairly new drivers: Up to 5 years of experience.
- 30 people: Enough for the main comparisons; driver "types" found in the data are exploratory.
- Weather types not ranked: Each was compared with clear weather, not with each other.
Why Car Warning Systems May Need Weather Settings
The researchers argue that a single alarm threshold for a tired or overloaded driver would miss these differences. A system watching for strain in fog might look at speed choices, while one in rain might rely more on heart and brain signals.
For everyday drivers, the takeaway is familiar but now measured: bad weather adds real mental load and frustration, even in a few minutes. Whether these patterns hold on real roads, with experienced drivers and longer trips, is the next thing to test.
Citation: DOI: 10.3389/fnins.2026.1919198. Tian Y, Hu J, Ding H, Yang B, Hu J, Liu Y, Ding Y. Multimodal sensor-based response mechanisms of drivers under adverse weather conditions using EEG spectral entropy and prediction entropy. Front Neurosci. 2026;20:1919198.
Study Design: Within-person driving simulator experiment; four weather conditions in counterbalanced order.
Sample Size: 30 licensed drivers; 6,456 ten-second data windows.
Key Statistic: NASA-TLX rose 10.96 (rain), 13.53 (snow) and 12.49 (fog) points vs. clear (all FDR-adjusted p < 0.001).
Caveat: Simulator only, short drives, relatively inexperienced drivers; model-based uncertainty measures depend on the classifier used.