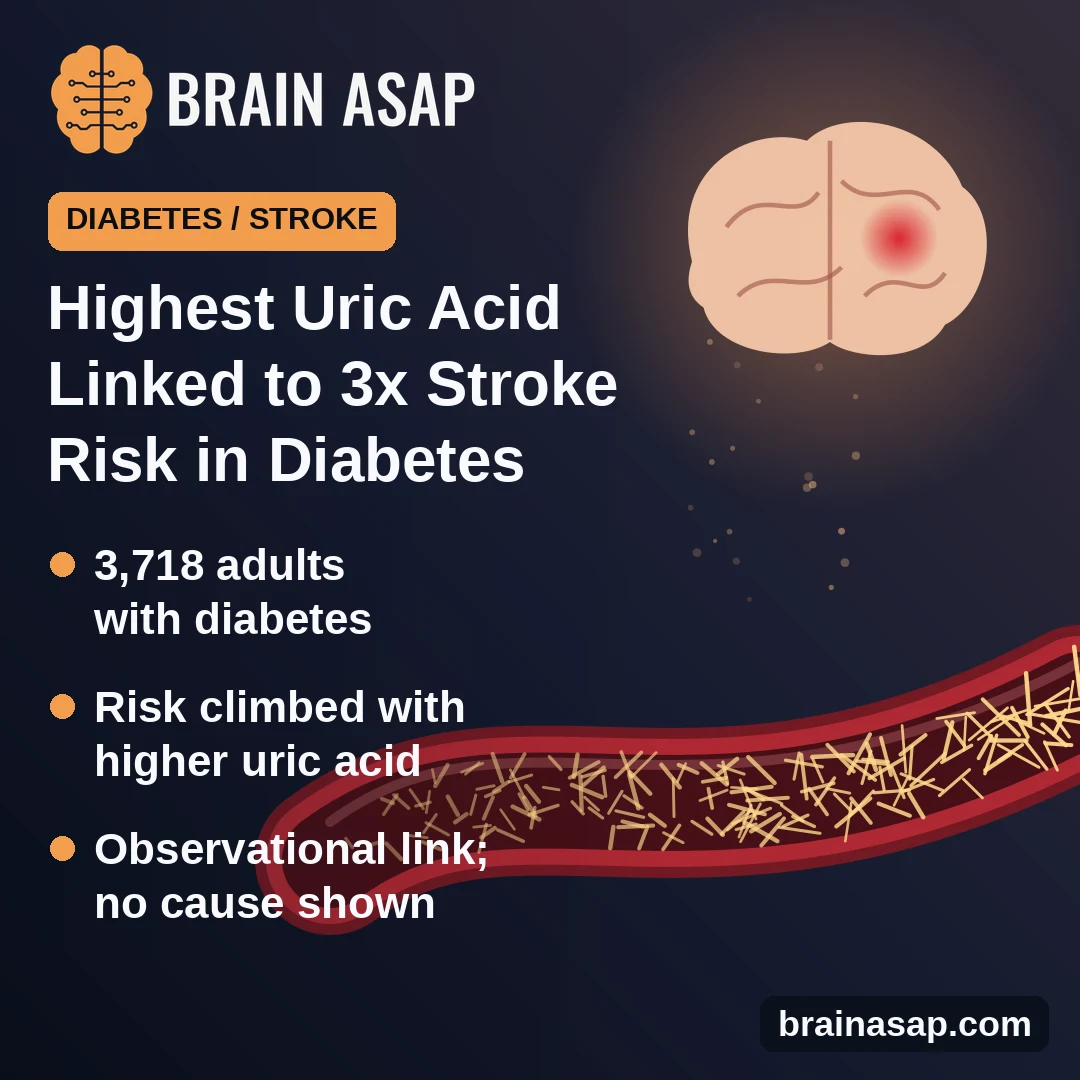
TL;DR: In 3,718 adults with diabetes, those in the highest quarter of blood uric acid had about 3 times the stroke risk of those in the lowest quarter. This shows a link, not that uric acid causes strokes.
Key Findings
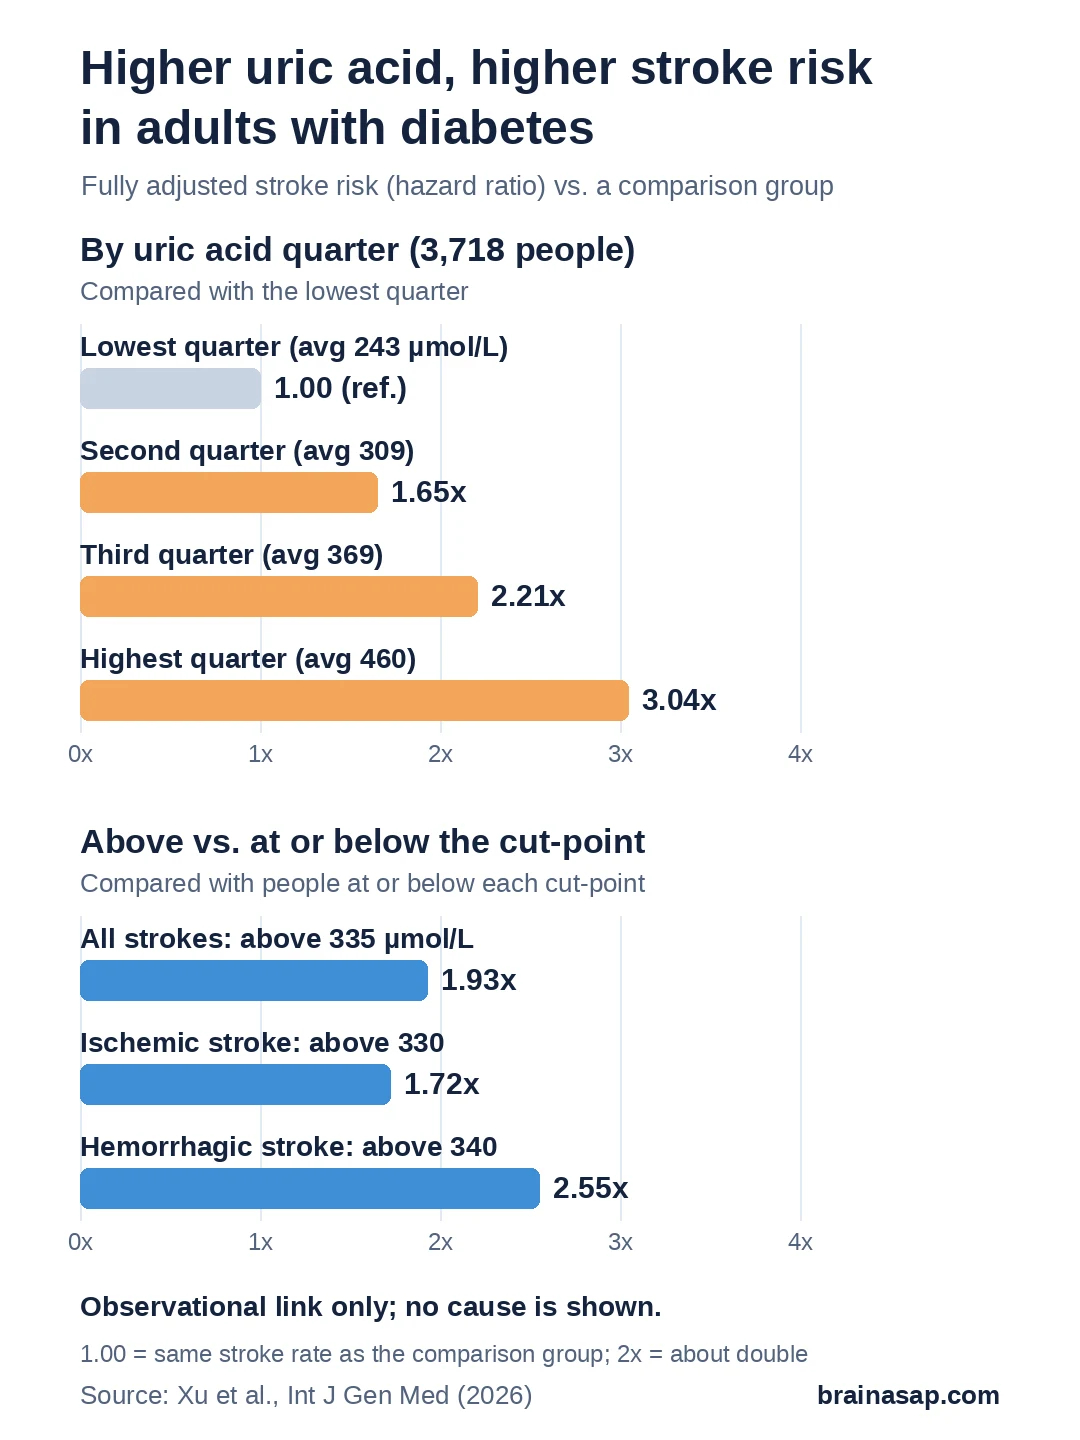
- Highest vs. lowest quarter: After adjusting for many other factors, stroke risk was 3.04 times higher in highest-uric-acid quarter than lowest.
- The authors’ cut-point: Above about 335 µmol/L, stroke risk was 1.93 times higher than at or below.
- Both stroke types: Clot-type (ischemic) strokes 1.72 times as likely above 330 µmol/L; bleeding-type (hemorrhagic) 2.55 times as likely above 340 µmol/L.
- A climb, not a U: Lowest quarter had lowest risk; no sign of extra risk at low uric acid.
- Association only: Uric acid measured once, at start; other explanations could remain.
Source: International Journal of General Medicine (2026) | Xu et al.
If you have diabetes, does the uric acid in your blood say anything about your stroke risk? In this study of 3,718 adults, it did: people in the top quarter for uric acid had about 3 times the stroke risk of people in the bottom quarter.
The authors also claim a “threshold” near 335 µmol/L. Their own curve tells a less tidy story.
Uric acid is a waste product your body makes when it breaks down purines, which are found in your own cells and in some foods. Most of it leaves in urine. When blood levels run high, it can crystallize in joints and cause gout. For years researchers have also wondered whether high uric acid quietly wears on blood vessels.
People with diabetes already face a higher risk of stroke, so a marker that flags who is at extra risk would be useful. This study asks whether uric acid could be that marker, and whether there is a level where the risk starts to climb.
Who Was Studied and How
The researchers pooled records from two diabetes cohorts at hospitals in China. After excluding people who had already had a stroke, were missing a uric acid measurement, took medicines that change uric acid, or had severe heart failure, cancer, or severe kidney problems, 3,718 adults remained. They averaged about 57 years old, and 55.5% were men. Type 1 and type 2 diabetes were analyzed together.
Each person had blood uric acid measured once, at the start. The team then tracked first strokes, confirmed by brain imaging and reviewed by two neurologists, until a stroke, death, or the end of follow-up on May 31, 2026. The median follow-up was 4.67 years, and 892 people had a first stroke: 607 ischemic (caused by a blocked vessel) and 285 hemorrhagic (caused by bleeding).
The authors split everyone into four equal-sized groups, or quarters, by uric acid level. Uric acid is reported in micromoles per liter (µmol/L). In this article:
- The lowest quarter averaged 243 µmol/L.
- The second quarter averaged 309.
- The third quarter averaged 369.
- The highest quarter averaged 460.
For context, the paper also used a common medical cutoff for hyperuricemia (high uric acid) of 420 µmol/L.
The groups differed in other ways. The highest quarter was more often male, had a higher body mass index, and had more high blood pressure (75% vs. 52% in the lowest quarter), high cholesterol, and heart disease. That is why the statistical adjustments matter.
Each step up in uric acid went with more strokes
The numbers below are hazard ratios, which compare how quickly strokes happened in one group versus a reference group at any point in follow-up. A ratio of 2 means roughly twice the rate. Every result here is from the fully adjusted model, which accounted for age, sex, body mass index, smoking, drinking, blood pressure, cholesterol and liver tests, blood sugar, kidney function, existing heart disease, and diabetes medicines.
Stroke risk stepped up with each quarter, compared with the lowest quarter:
- Second quarter: 1.65 times the risk
- Third quarter: 2.21 times
- Highest quarter: 3.04 times
Put another way, each one standard deviation increase in uric acid (about 87 µmol/L) went with a 54% higher stroke risk. Hemorrhagic strokes showed the steepest gradient: the highest quarter had 4.56 times the risk of the lowest, versus 2.58 times for ischemic strokes.
People whose uric acid was above 420 µmol/L (631 of the 3,718) had 2.00 times the stroke risk of those below it.
The Authors’ Threshold of About 335 µmol/L
The study’s headline claim is that the relationship is nonlinear. That means the curve is not a perfectly straight line: risk does not rise by exactly the same amount for every step up in uric acid.
To look for this, the authors fitted a smooth curve to the data (restricted cubic splines) and marked the uric acid level where the curve crosses the “no difference” line, a hazard ratio of 1. That happened at about 335 µmol/L for all strokes, 330 for ischemic strokes, and 340 for hemorrhagic strokes. They called these points thresholds and compared people above each one with people at or below it:
- All strokes: 1.93 times the risk above 335
- Ischemic strokes: 1.72 times above 330
- Hemorrhagic strokes: 2.55 times above 340
For comparison, the paper’s introduction points out that guidelines on gout and high uric acid have used a level of around 360 µmol/L (6 mg/dL).
What the Curve Shows
It is easy to hear “threshold” and picture a flat safe zone below one number and a sudden jump above it. The paper’s own curve looks different, and the wording matters.
- The curve slopes upward all the way. Estimated risk keeps falling as uric acid drops below 335 and rising above it. 335 is where the curve crosses the reference line, not where a flat stretch turns into a climb. Authors report the curve is statistically nonlinear, but the bend is gentle.
- The second quarter was already higher. Averaged 309 µmol/L, below the cut-points, yet risk was 1.65 times the lowest quarter.
- It is not a U or J shape. A U or J shape would mean extra risk at very low levels too. This study did not show that; risk simply climbed with uric acid.
- The cut-points are estimates. Read from a fitted curve; exact numbers (335, 330, 340) would likely shift in another group. “Above vs. at or below” is a simple two-group split, not proof of a safe level.
Men and women. The authors also repeated the analysis by sex. Cut-points for all strokes were 335 µmol/L in men and 350 in women, and risk above each was about 2.1 times higher in both. However, the statistical test for whether sex changes the uric acid effect was not significant (P = 0.412). The authors themselves call the sex-specific cut-points hypothesis-generating, and they should not be read as different targets for men and women.
Limitations
- Association, not cause: Observational study. Adjustment helps but cannot remove every difference between high and low uric acid groups, such as diet or inflammation, which were not measured.
- Not a treatment test: Nobody was assigned to lower uric acid, so unclear whether urate-lowering drugs would prevent strokes in people with diabetes.
- One measurement: Checked once at start; levels change over time.
- Missing information: No data on how long people had diabetes or on diet. People on uric-acid-altering drugs at start were excluded, but medicine changes during follow-up were not tracked.
- Mixed group, one region: Type 1 and type 2 combined; participants largely Chinese, so results may not carry over.
- Hazard ratios are not personal odds: 1.9 times higher rate is a group-level comparison, not a prediction for one person.
Repeated Measurements and Trials Are Warranted
The finding adds to a body of work suggesting that a routine, inexpensive blood test may carry information about stroke risk in people with diabetes. The clearest takeaway is the steady climb: in this group, the higher the uric acid, the higher the stroke risk, with the highest quarter well above the rest.
This is a signal worth following up. It is not a reason to chase a particular number, and anyone with diabetes and questions about their uric acid or stroke risk should raise them with their own doctor.
The open question is whether changing uric acid changes anything. Answering it takes prospective trials, and studies that measure uric acid repeatedly, as the authors call for.
Citation: DOI: 10.2147/IJGM.S643145. Xu S, Yuan J, Guo Y, An K, Liu C, Wang H, Li M. Nonlinear association between serum uric acid and incident stroke in patients with diabetes: a two-centre cohort study. International Journal of General Medicine. 2026;19:643145.
Study Design: Observational cohort study using data from two hospital-based diabetes cohorts in China; Cox proportional hazards models with stepwise adjustment, restricted cubic spline curves, piecewise (threshold) models, and Fine-Gray competing-risk models.
Sample Size: 3,718 adults with diabetes (of 5,617 initially enrolled); median follow-up 4.67 years; 892 first strokes (607 ischemic, 285 hemorrhagic).
Key Statistic: Fully adjusted hazard ratio for stroke, highest vs. lowest uric acid quarter, 3.04 (95% CI 2.42 to 3.82); above vs. at or below 335 µmol/L, 1.93 (95% CI 1.66 to 2.24).
Caveat: Observational, single baseline uric acid measurement, no diabetes duration or diet data, mixed diabetes types, largely Chinese participants; sex-specific cut-points were exploratory (sex interaction P = 0.412).