TL;DR: A 2026 preprint on medRxiv followed 72 people with bipolar disorder who wore wrist activity monitors and asked whether day-to-day swings in sleep and activity carry information about mood episodes beyond weekly averages. They did — the swings were linked to depression and mania weeks even after a statistical check — but adding them only nudged up how well models could tell episode weeks from stable ones.
Key Findings
- Depression weeks showed the clearest pattern: Day-to-day variation in 16 of 22 sleep and activity measures differed between depression weeks and remission weeks, mostly in sleep-related measures.
- Mania weeks showed a weaker one: Variation differed between mania weeks and remission weeks for 11 of 22 measures.
- Mostly not a math artifact: After a correction that separated swings from averages, 12 of 13 at-risk measures in depression and 7 of 10 in mania still showed a link.
- Three nighttime measures in mania didn't survive: Their apparent link came largely from a handful of very active nights inflating averages and swings together.
- Accuracy stayed modest: Combined models scored about 0.52 to 0.66 on a 0.5 (coin flip) to 1.0 (perfect) scale, so no wearable here can flag an individual's episode.
Source: medRxiv preprint (2026) | Konicarova et al.
Mood episodes in bipolar disorder rarely arrive quietly. Depression tends to bring less movement and disrupted sleep; mania tends to bring more energy, more activity, and less sleep. That makes wrist-worn activity monitors an appealing tool: they record sleep and movement around the clock, with no questionnaire to fill in.
Most research has looked at averages — how much someone moved or slept in a typical day. But a growing number of studies suggest the irregularity may matter too: how much those numbers swing from one day to the next. A week of scattered bedtimes and uneven activity might say something about mood that a steady average hides.
There's a catch, and it's the point of this study. For many measures, averages and swings are mathematically tangled together.
Why Bigger Averages Can Fake Bigger Swings
Think about activity between midnight and 6 a.m. For someone sleeping normally, it's close to zero almost every night. If a person has a few restless nights, the week's average goes up — and so does its day-to-day variation, simply because a few large numbers now sit among many near-zeros.
That means a study could find that "variability" tracks mania when it's really just echoing a higher average. Researchers set out to test whether day-to-day variation carries its own information about mood episodes once that built-in connection is removed.
Wrist Monitors Tracked 72 People Through Episodes and Remission
The data came from a long-running Czech study of 326 adults with bipolar disorder who were in a stable mood when they enrolled. Participants wore a wrist activity monitor continuously and completed a short mood questionnaire each week, typically for more than two years in the group analyzed here.
A subset also had monthly phone interviews with clinicians using standard depression and mania rating scales. Combining those ratings with the weekly questionnaires and health records such as hospital admissions, researchers labeled each week as depression, mania (including milder hypomania), or remission.
The analysis needed people who had both kinds of weeks, so it included 72 participants:
- Mania comparison: 34 people, contributing 180 mania weeks and 861 remission weeks.
- Depression comparison: 58 people, contributing 490 depression weeks and 1,356 remission weeks.
From the monitor data, researchers calculated 22 daily measures — 8 about daytime activity and 14 about sleep, such as sleep duration, the midpoint of sleep, and activity during the most active 10 hours of the day. Each week then got two numbers per measure: its average and its within-week variation, meaning how much the daily values bounced around that average.
A Statistical Correction Untangled Swings From Averages
To break the link between the two, researchers reshaped each measure's lopsided data with standard mathematical transformations before computing the weekly numbers. It worked: the correlation between weekly averages and weekly variation dropped from about 0.43 to between 0.04 and 0.06, close to no connection at all.
They then compared episode weeks with remission weeks within the same people, using models that allowed each person to have their own baseline. That matters because people differ a lot in how much they normally move and sleep.
Swings Tracked Depression More Consistently Than Mania
After the correction, within-week variation was still linked to mood state for 16 of 22 measures in depression and 11 of 22 in mania. In depression, most of the linked measures were about sleep.
The sharpest test involved the measures most at risk of a misleading result — those where both the average and the variation were linked to mood before the correction. In depression, 12 of 13 held up. In mania, 7 of 10 did.
The three that failed in mania were exactly the kind described above: activity between midnight and 6 a.m., activity just before waking, and the change in activity around falling asleep. The researchers note that the manic nights themselves are real; the problem is only that those near-zero-baseline measures can't separate a higher average from genuinely more erratic behavior.
Adding Swings Only Slightly Improved Episode Detection
The practical question is whether knowing a week's variation helps tell episode weeks from remission weeks better than the average alone. Researchers scored this with AUC, a standard accuracy measure where 0.5 is no better than a coin flip and 1.0 is perfect.
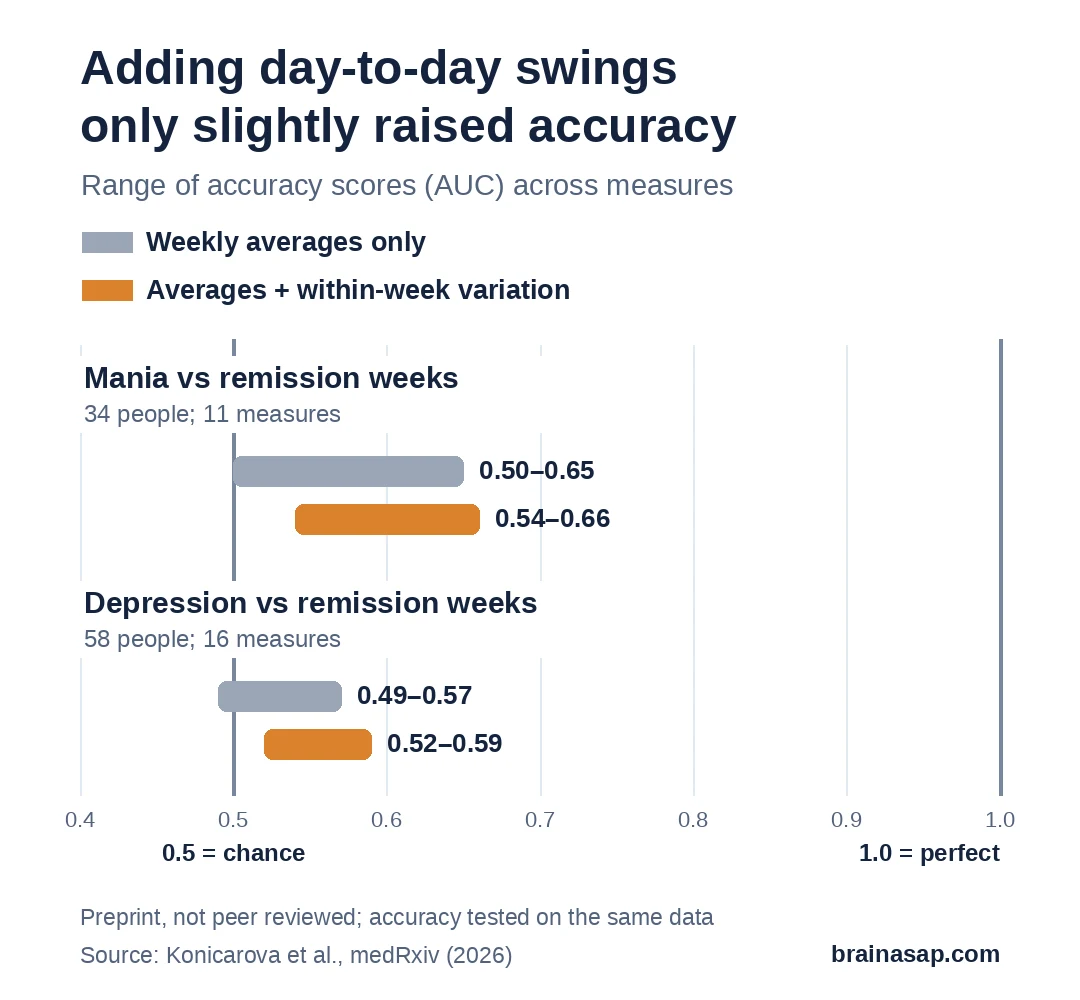
Adding variation improved the statistical fit of the models for 9 of 11 measures in mania and all 16 in depression. But the accuracy gains were small. For mania, scores ranged from 0.50–0.65 with averages alone and 0.54–0.66 with variation added. For depression, they moved from 0.49–0.57 to 0.52–0.59.
Those numbers sit much closer to a coin flip than to a reliable test. The authors say as much: the gains are unlikely to give variation much clinical value on its own. Their suggestion is to treat it as one input among several, alongside mood questionnaires and other digital measures, rather than as a standalone warning sign.
Small Samples, Same-Data Testing, and Preprint Status Limit the Result
The accuracy scores were calculated on the same data used to fit the models. That typically flatters performance, so results in new patients could be weaker still.
The episode comparisons were also small — 34 people for mania and 58 for depression — and weeks from the same person are related in ways the models didn't fully capture. Mixed or borderline mood weeks were left out, and the choice of a one-week window could itself shape how variation behaves.
This is an association study. It doesn't show that irregular sleep causes episodes, or that episodes cause irregular sleep, and it doesn't show that a wrist monitor can detect or diagnose an individual's episode.
The paper is a preprint and hasn't been peer reviewed. Four of the six authors worked for or had financial interests in Mindpax, the company behind the monitor and questionnaire, at various points during the study; the authors state that the company had no role in the analysis or interpretation.
Citation: DOI: 10.64898/2026.07.15.26358139. Konicarova et al. Rest-Activity Rhythm Variability Across Clinical Episodes of Bipolar Disorder: Standalone Biomarker or Statistical Artifact? medRxiv preprint. 2026.
Study Design: Observational longitudinal analysis of wrist actigraphy, using mixed-effects models to compare episode weeks with remission weeks within participants.
Sample Size: 72 adults with bipolar disorder (34 in the mania comparison, 58 in the depression comparison), drawn from a 326-person cohort.
Key Statistic: After correction, within-week variation was linked to mood state for 16 of 22 measures in depression and 11 of 22 in mania; combined-model AUC reached 0.52–0.66.
Caveat: Preprint posted 17 July 2026 and not peer reviewed; small episode samples and same-data accuracy testing mean the results cannot support individual episode detection.