A study used a 7-Tesla MRI to discover that major depressive disorder (MDD) is linked to lower intracortical myelination, particularly in brain regions associated with negative emotions.
Highlights:
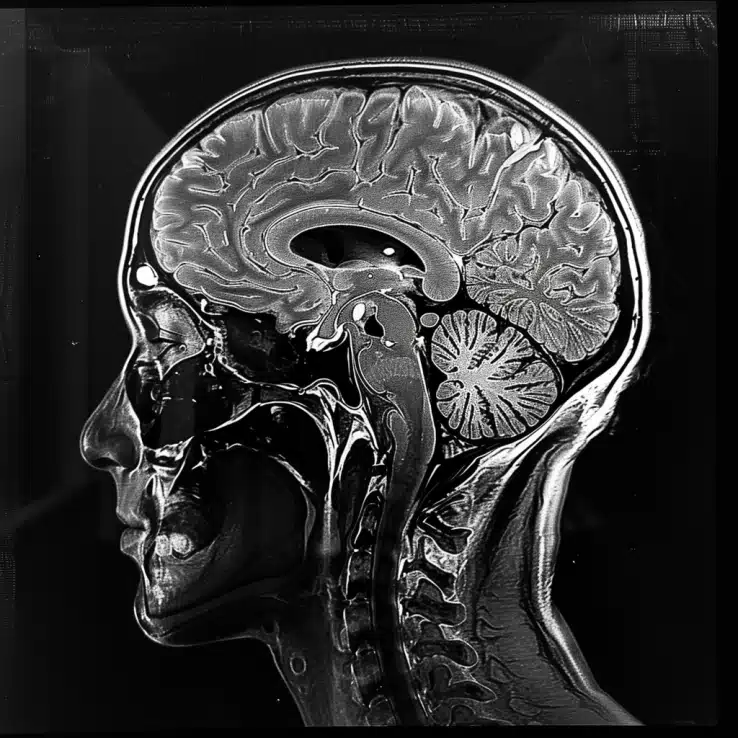
- Advanced MRI: The study used Ultra-High Field MRI at 7.0 Tesla to gain detailed insights into brain microstructures in MDD patients.
- Brain Regions: Researchers focused on the orbitofrontal and rostral anterior cingulate cortices, areas crucial for processing emotions and decision-making.
- Decreased Myelination: MDD patients showed lower intracortical myelination (indicated by higher T1 values) in the lateral orbitofrontal cortex, linked to increased symptom severity.
- No Iron Changes: There were no significant differences in local iron concentrations between MDD patients and healthy controls.
- Potential Implications: These findings suggest that decreased intracortical myelination might contribute to the structural brain changes seen in MDD, providing potential new biomarkers and therapeutic targets.
Source: Translational Psychiatry (2024)
Brain Microstructure Abnormalities & Depression (Overview)
Emerging research highlights that abnormalities in brain microstructure, particularly in the cortex, play a crucial role in the pathophysiology of depression.
These microstructural changes can affect neural circuits and networks essential for mood regulation, cognitive function, and emotional processing.
Key Brain Regions
Prefrontal Cortex: The prefrontal cortex, responsible for executive functions and decision-making, often shows reduced volume and altered connectivity in depressed individuals. Changes in this region can impair cognitive control over emotions.
Anterior Cingulate Cortex (ACC): The ACC is involved in emotional regulation and error detection. Microstructural abnormalities in the ACC, such as reduced gray matter volume and altered white matter integrity, are linked to the severity of depressive symptoms.
Hippocampus: The hippocampus, critical for memory formation and emotional regulation, typically exhibits reduced volume in depressed patients. This reduction is associated with difficulties in forming positive memories and increased susceptibility to negative emotions.
Amygdala: The amygdala, central to processing emotional responses, often shows hyperactivity and volume changes in depression. These abnormalities contribute to heightened emotional reactivity and the persistence of negative mood states.
Microstructural Changes
Myelination: Myelin sheaths insulate axons and facilitate efficient neural transmission. Reduced myelination, particularly in the prefrontal cortex and ACC, can disrupt communication between brain regions, leading to impaired emotional regulation and cognitive function in depression.
Neuroinflammation: Chronic stress and depression are linked to increased neuroinflammation, characterized by elevated levels of pro-inflammatory cytokines. This inflammation can damage neurons and glial cells, contributing to microstructural changes and neural dysfunction.
Neurogenesis: Depression is associated with reduced neurogenesis, particularly in the hippocampus. Decreased production of new neurons can impair brain plasticity and resilience, exacerbating depressive symptoms.
Synaptic Plasticity: Depression can alter synaptic plasticity, the ability of synapses to strengthen or weaken over time. Changes in synaptic plasticity can affect learning, memory, and mood regulation.
Main Findings: Microstructure of Depressed Brains with 7-Tesla MRI (2024)

1. Intracortical Myelination
In the lateral orbitofrontal cortex (lOFC) of MDD patients, intracortical myelination was significantly reduced.
Technique: T1 relaxation time served as the proxy for myelination levels, with higher T1 values indicating lower myelination.
Results: MDD patients showed higher T1 values in the lOFC compared to healthy controls, indicating a decrease in myelin.
Symptom Correlation: The severity of depression symptoms was linked to the level of myelination. Patients with more severe symptoms had higher T1 values, suggesting even lower myelination.
2. Iron Concentration
No significant differences in iron concentration were found between MDD patients and healthy controls in the studied regions.
Technique: T2* relaxation time was used as the proxy for iron levels, with lower T2* values indicating higher iron concentration.
Results: Both MDD patients and healthy controls exhibited similar T2* values, indicating that iron concentration was not significantly altered in MDD.
3. Regional Specificity
Brain Regions: The research specifically focused on the orbitofrontal cortex and the rostral anterior cingulate cortex, areas known for their role in emotion and decision-making.
Significant Area: The significant findings were primarily in the lateral orbitofrontal cortex (lOFC), while other regions did not show notable differences.
Study Details: Microstructure of Depressed vs. Healthy Brains (2024)
Population
Total Participants: 58 individuals were included in the study.
Groups
- MDD Patients: 48 participants diagnosed with Major Depressive Disorder (MDD).
- Healthy Controls (HC): 10 participants with no history of depression or other psychopathology.
Criteria
- MDD Group: Diagnosis of current MDD according to DSM-5 criteria, as determined by the Composite International Diagnostic Interview (CIDI), and referral to mental health care.
- HC Group: No history of depression or other psychopathology, normal or subclinical scores on dimensional measures of psychopathology.
Exclusion Criteria
- Presence of psychoses, mania, Tourette’s syndrome, or obsessive-compulsive disorder.
- Diagnosis of major internal or neurological disorders.
- Traumatic head injury.
- Current substance abuse or dependence requiring treatment.
- Evidence of acute suicidal risk requiring immediate intervention.
- MRI contraindications (e.g., metal implants, heart arrhythmia, claustrophobia).
- Left-handedness.
- Pregnancy.
- Inadequate understanding of the Dutch language.
- Age below 20 or above 55 years.
Methods
MRI Scans: Philips Achieva 7.0 Tesla MRI scanner with a 32-channel head array coil.
Imaging Techniques:
- T1-Mapping: To measure intracortical myelin levels using the MP2RAGEME sequence.
- T2-Mapping: To assess local iron concentration using multi-echo readouts.
Parameters:
- T1-Mapping: Included inversion times (TI1,2 = [670 ms, 3675.4 ms]), flip angles (FA1,2 = [4°, 4°]), repetition times (TRGRE1,2 = [6.2 ms, 31 ms]), field of view (FOV = 205 × 205 × 164 mm), and voxel size (0.7 × 0.7 × 0.7 mm).
- T2-Mapping: Utilized echo times (TE1 = 3 ms, TE2,1–4 = 3, 11.5, 19, 28.5 ms), turbo factor (TFE = 150), and total acquisition time (19.53 min).
Data Analysis:
- Regions of Interest (ROIs): Focused on the rostral anterior cingulate cortex (rACC), medial orbitofrontal cortex (mOFC), and lateral orbitofrontal cortex (lOFC).
Statistical Methods:
- ANCOVA: Compared MDD and HC groups on T1 and T2* values, controlling for age and sex.
- Correlation Analysis: Assessed relationships between clinical features (severity, medication use, comorbid anxiety, childhood trauma) and myelination/iron levels.
Limitations
- Sample Size: The study had a relatively small sample size, especially in the healthy control group, which may limit the generalizability of the findings.
- Cross-Sectional Design: The study’s cross-sectional nature precludes causal inferences about the observed changes in myelination and iron concentration.
- Unbalanced Groups: The larger number of MDD patients compared to healthy controls might introduce bias, although the use of quantitative MRI techniques helps mitigate this issue by allowing comparisons to normative baselines.
- Limited Scope: The study did not aim to replicate previous findings on cortical thickness and surface area due to differences in sample size and MRI resolution.
- Focus on Specific Brain Regions: While the study provided detailed insights into the orbitofrontal and anterior cingulate cortices, other brain regions potentially relevant to MDD were not examined.
- Potential Confounding Factors: The study did not account for all possible confounding variables, such as lifestyle factors or comorbid medical conditions, which could influence myelination and iron levels.
- Financial & Time Constraints: The high costs and time requirements of UHF MRI research limited the sample size and the extent of the study.
Possible Reasons for Lower Intracortical Myelination in Major Depression
1. Decreased Axonal Activity
Myelination Dependence on Neural Activity: Myelination is an adaptive process that relies heavily on axonal activity. Axons that fire more frequently promote the growth of myelin sheaths, enhancing the efficiency of neural transmission.
Reduced Neural Firing in MDD: In Major Depressive Disorder, there may be reduced axonal firing in key brain regions such as the lateral orbitofrontal cortex (lOFC). This decreased neural activity can lead to reduced myelin production.
Supporting Evidence: Studies have shown that in conditions of decreased neural activity, myelination is significantly reduced. Conversely, increased axonal activity has been associated with greater myelination.
2. Stress-Induced Neuroinflammation
Chronic Stress Impact: Chronic stress, a common factor in MDD, leads to the release of pro-inflammatory cytokines in the brain.
Cytokine Effect on Myelin: These cytokines can damage myelin sheaths and inhibit the function of oligodendrocytes, the cells responsible for myelination.
Inflammatory Markers: Elevated levels of inflammatory markers have been found in the brains of individuals with MDD, suggesting a link between chronic inflammation and myelin damage.
3. Neurotransmitter Imbalances
Dopamine and Serotonin Deficiency: MDD is often characterized by imbalances in key neurotransmitters, including dopamine and serotonin.
Role in Myelination: These neurotransmitters play a crucial role in promoting myelination. Dopamine, for instance, has been shown to stimulate oligodendrocyte activity and myelin production.
Deficiency Consequences: A deficiency in these neurotransmitters can lead to reduced oligodendrocyte function and decreased myelination.
4. Genetic Factors
Hereditary Influence: Genetic predispositions can influence the structure and function of myelin. Certain genetic variants have been associated with a higher risk of developing MDD.
Myelination-Related Genes: Some of these genetic factors affect genes that are directly involved in the myelination process, potentially leading to lower myelination in individuals with MDD.
5. Environmental Factors
Early Life Stress: Adverse experiences in early life, such as trauma or neglect, are risk factors for MDD and have been linked to long-term changes in brain structure, including myelination.
Experience-Dependent Myelination: Myelination is highly sensitive to environmental influences. Negative environmental conditions can disrupt normal myelination processes, leading to deficits in brain regions implicated in MDD.
6. Oxidative Stress
Role of Oxidative Damage: MDD has been associated with increased oxidative stress, which can damage cellular structures, including myelin.
Mechanisms of Damage: Oxidative stress leads to the production of free radicals, which can damage the lipid components of myelin sheaths, compromising their integrity and function.
How could these findings be used to help patients with depression?
Diagnostics
Biomarkers for Early Detection
The identification of specific microstructural changes, such as reduced intracortical myelination, can serve as biomarkers for early detection of Major Depressive Disorder (MDD).
Advanced imaging techniques can be integrated into clinical practice to diagnose depression before the full onset of symptoms, allowing for timely intervention.
Personalized Medicine
Understanding individual differences in brain microstructure can lead to more personalized treatment plans.
Tailoring therapies based on a patient’s specific neural profile may enhance the efficacy of interventions and reduce the trial-and-error period often associated with antidepressant prescriptions.
Therapeutic Targeting
Targeted Therapies
The findings highlight intracortical myelination as a potential therapeutic target.
Developing drugs or interventions that promote myelin repair and maintenance could offer new treatment avenues.
For example, agents that enhance oligodendrocyte function or reduce neuroinflammation might help restore normal myelination patterns.
Neuroplasticity Enhancement
Treatments aimed at boosting neuroplasticity, such as neurotrophic factors, cognitive training, and non-invasive brain stimulation techniques, could benefit patients by reversing microstructural abnormalities and improving mood and cognitive functions.
Monitoring Treatment Efficacy
Imaging Biomarkers
Quantitative MRI can be used to monitor the effectiveness of treatments by tracking changes in brain microstructure over time.
This approach allows clinicians to objectively assess how well a therapy is working and make necessary adjustments to treatment plans.
Predicting Treatment Response
Identifying specific microstructural patterns associated with better or worse treatment outcomes can help predict how patients will respond to different therapies, guiding more effective treatment choices.
Conclusion: Microstructural Abnormalities in Depression
References
- Study: Quantitative MRI at 7-Tesla reveals novel frontocortical myeloarchitecture anomalies in major depressive disorder (2024)
- Authors: Jurjen Heij et al.