TL;DR: A 2026 analysis of 1,058 people with amyloid, the protein that builds up early in Alzheimer’s, combined their brain scans and spinal fluid tests into 4 disease scores. Those scores did a good job predicting who would move to a more advanced stage of memory decline, but adding them to standard memory and daily-living tests improved predictions only slightly.
Key Findings
- 4 scores from biology alone: amyloid, tau, brain-cell loss, and a leftover score tied to fluid-filled spaces and blood vessel damage in the brain.
- Scores tracked thinking tests they never saw: they explained about half the variation in a standard memory-and-thinking test (49.7%).
- Good at predicting decline on their own: 0.843 on a ranking scale where 1 is perfect and 0.5 is a coin flip.
- Little gain over standard tests: memory and daily-living tests alone scored 0.929; adding the biology scores raised that to 0.933.
- Tau mattered most: each increase of 1 standard deviation in the tau score went with about twice the rate of decline before adjusting for test results, and about 34% higher risk after.
Source: Neurology and Therapy (2026) | Haji and Tahami Monfared
Two people with Alzheimer’s can score the same on a memory test and still be at very different points in the disease underneath. Doctors increasingly measure that hidden biology with brain scans, spinal fluid tests and, more recently, blood tests.
A 2026 study in Neurology and Therapy, by researchers at the drug company Eisai, asked how much those biology measures tell you about what comes next.
Turning Many Tests Into 4 Scores
The analysis used the Alzheimer’s Disease Neuroimaging Initiative, a long-running North American research study that follows volunteers with regular scans, spinal fluid tests and thinking tests.
It included 1,058 people whose spinal fluid showed amyloid buildup, from people with normal thinking to people with dementia.
A statistical method combined their many biology measures into 4 scores, guided by the standard way Alzheimer’s biology is grouped:
- Amyloid: the sticky protein that forms plaques.
- Tau: a protein that forms tangles inside nerve cells.
- Brain-cell loss: shrinking of brain regions on MRI and related markers.
- Leftover score: mostly enlarged fluid-filled spaces and blood vessel damage.
Thinking tests, daily-living ratings and diagnoses were deliberately kept out of the scores. That way the team could check, fairly, whether biology alone tracked how people were doing.
Biology Scores Tracked Memory and Daily Life
Even without seeing any test results, the 4 scores explained:
- 49.7% of the variation in a standard memory-and-thinking test (ADAS-Cog13)
- 35.1% of the variation in a dementia severity rating (CDR-SB)
- 27.8% of the variation in a questionnaire about everyday tasks like paying bills
Amyloid and tau scores were the most stable across repeated runs and held up in people left out of the model-building.
Did the Scores Help Predict Who Would Decline?
Among 1,010 people with complete data, 497 moved to a more advanced stage during follow-up, such as from normal thinking to mild cognitive impairment, or from mild to moderate dementia.
Three prediction models were compared using a ranking score, where 1.0 means the model always correctly picks who declines first and 0.5 is no better than a coin flip.
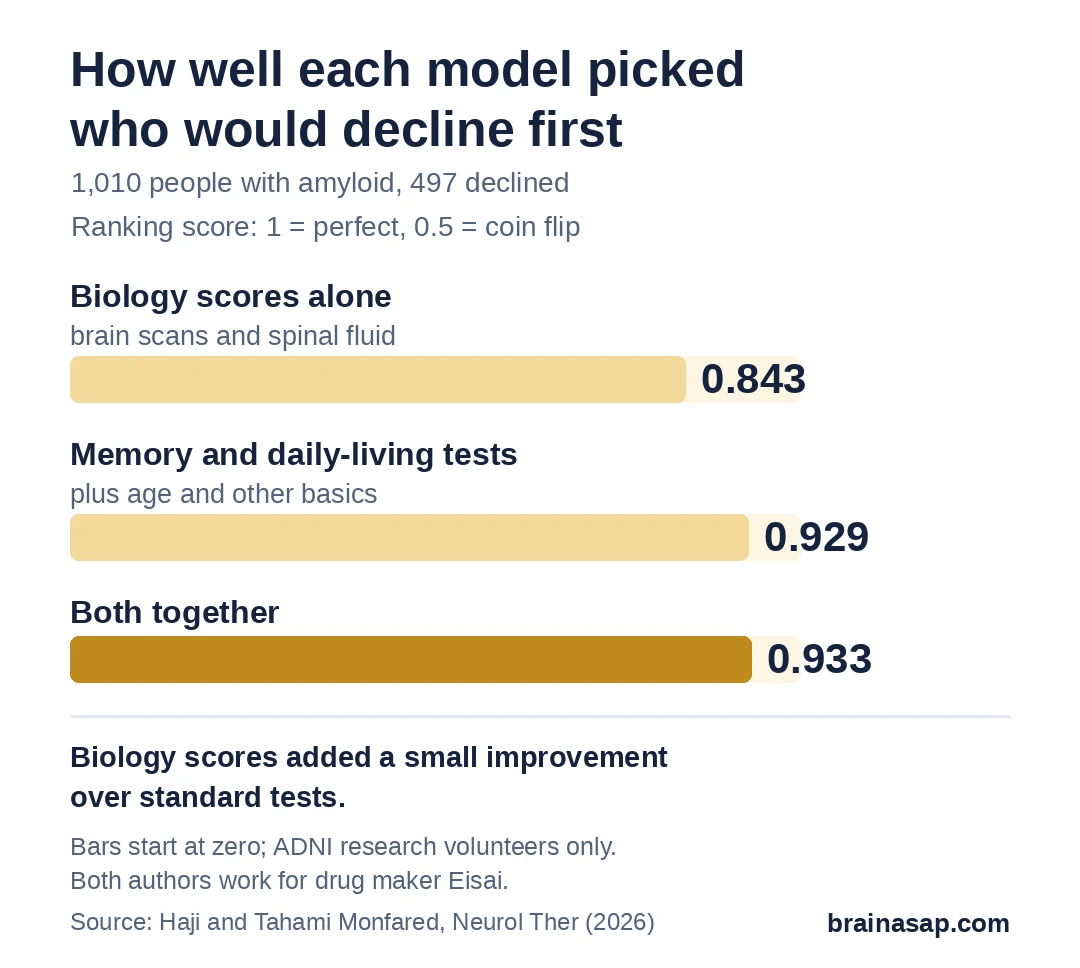
The result? Standard tests did most of the work. How someone scored on memory and daily-living tests today was the best guide to their near-term future.
Still, 3 biology scores carried extra information. Even after accounting for test results, each increase of 1 standard deviation in a score went with a higher rate of decline:
- Tau: 34% higher risk
- Amyloid: 27% higher risk
- Brain-cell loss: 15% higher risk
The leftover score no longer mattered once test results were included.
The Longer People Stayed Normal, the Higher the Risk
Risk also depended on how long someone had been at a stage. For people with normal thinking, the estimated annual transition rate to mild cognitive impairment rose from about 0.04 per year in the first 6 months to about 0.54 per year after 2 years. These are rates, not yearly probabilities.
For later stages, risk peaked 1 to 2 years in, then fell. Haji and Tahami Monfared argued that cost and planning models for Alzheimer’s should account for this rather than assume a fixed yearly rate.
Who Ran the Analysis, and Other Limits
- Company-run: both researchers work for Eisai, which co-markets the Alzheimer’s drug lecanemab and funded the work.
- One research group: volunteers in a research study are more educated and less diverse than typical patients; the scores need testing in other groups.
- Older biomarkers: newer blood tests such as p-tau217 weren’t available across the whole dataset.
- Prediction, not cause: the scores flag risk; they don’t show what drives decline.
Where Biology Scores Could Matter Most
For a person sitting in a doctor’s office, today’s memory and daily-living tests remain the strongest guide to what the next few years hold. Biology scores add a little on top.
Where they may matter more is earlier, before tests show much change, and in clinical trials that need to pick people likely to decline. Whether that holds outside this research group is the open question.
Citation: DOI: 10.1007/s40120-026-01036-5. Haji B, Tahami Monfared AA, for the Alzheimer’s Disease Neuroimaging Initiative. From biomarker anchors to disease-state transitions: a biologically anchored probabilistic principal component analysis framework for Alzheimer’s disease progression modeling. Neurol Ther. 2026.
Study Design: Secondary analysis of ADNI data using biomarker-anchored probabilistic principal component analysis, Cox models and clinical-state transition analyses.
Sample Size: 1,058 amyloid-positive participants; 1,010 in survival analyses with 497 progression events.
Key Statistic: C-index 0.929 (clinical only) vs. 0.933 (clinical plus biomarker scores); 0.843 for biomarker scores alone.
Caveat: Internal validation within ADNI only; authors employed by Eisai; no newer plasma biomarkers.