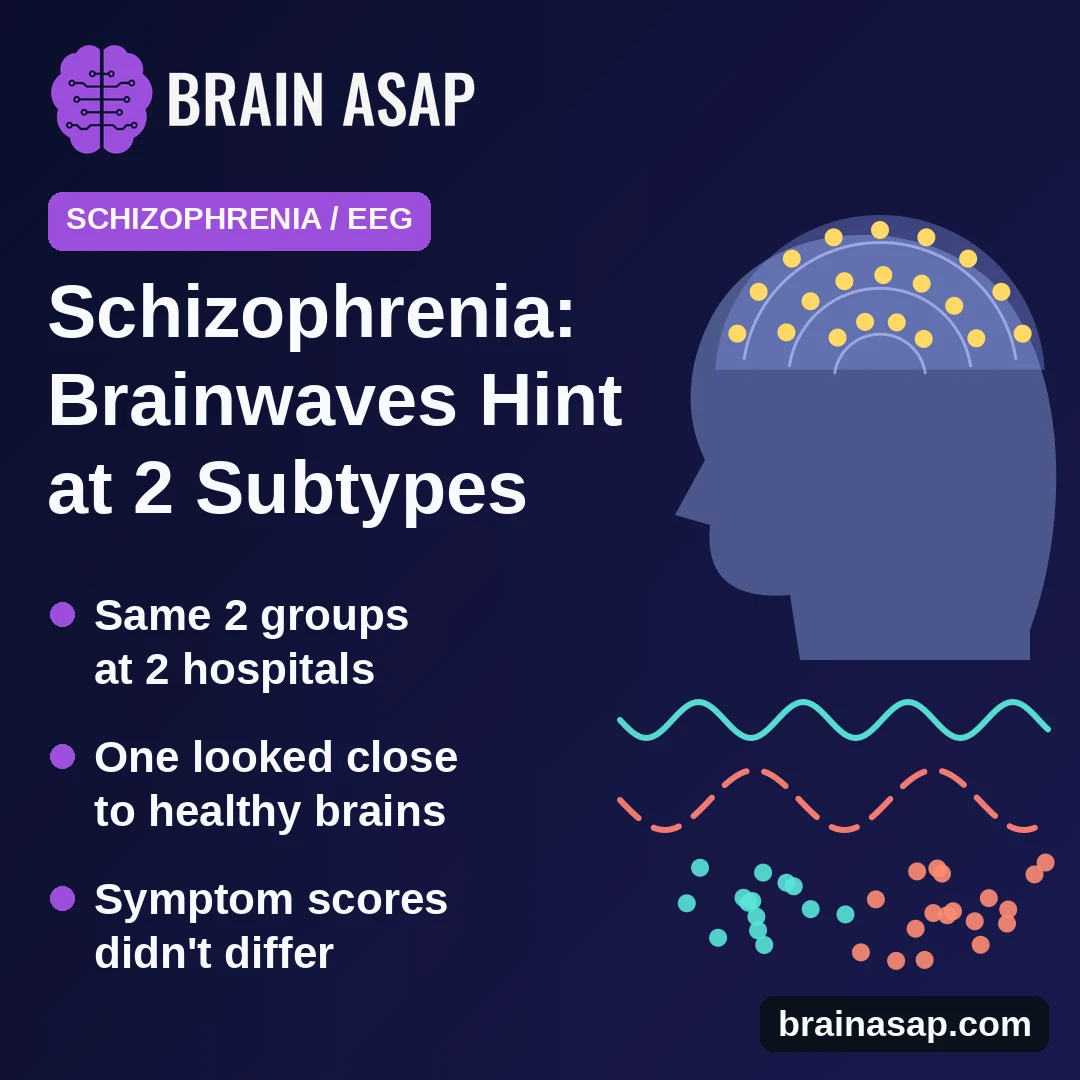
TL;DR: Researchers recorded brainwaves while 175 adults with long-term schizophrenia sat quietly, then let a computer sort them by how different brain areas worked together. 2 groups appeared in 2 separate hospitals: one with clearly disrupted brain connections and one that looked close to healthy volunteers, even though both groups had similar symptoms.
Key Findings
- 2 brainwave groups: a computer split patients into the same 2 groups in a first hospital (86 patients) and a second hospital (89 patients).
- Disrupted group: connections between areas on the sides and back of the brain were weaker than in healthy volunteers; the model more clearly distinguished this group from volunteers, with separation scores of 0.92 and 0.90.
- Near-normal group: brain connections looked so close to healthy volunteers that, in the second hospital, the computer did no better than a coin flip.
- Same symptoms on paper: the 2 groups scored about the same on a standard schizophrenia symptom scale.
- Linked to symptoms in 1 group only: in the disrupted group, brainwave patterns moderately tracked how severe patients' withdrawal-type symptoms were.
Source: General Psychiatry (2026) | Ding, Li, Liu, Jin and colleagues
2 people with schizophrenia can share a diagnosis and similar symptoms yet respond very differently to the same treatment.
One explanation is that schizophrenia covers several different brain problems under one name. Finding those hidden groups reliably has been hard, partly because brain-scan results often fail to repeat from one hospital to the next.
Sorting Patients by Their Resting Brainwaves
A 2026 study in General Psychiatry, led by teams at Ningbo University, Shanghai Jiao Tong University and hospitals in eastern China, used EEG, a cap of 128 sensors that picks up the brain's electrical activity through the scalp.
Each patient sat still for 5 minutes with eyes closed and 5 minutes with eyes open. From those recordings, the team estimated how closely the rhythms in 31 brain areas rose and fell together, a sign of how well those areas communicate.
A computer program then grouped patients by those connection patterns alone, without being told anything about their symptoms.
Patients came from 2 hospitals:
- First hospital: 86 adults, average age 44
- Second hospital: 89 adults, average age 41
- Healthy volunteers: 43 men of similar age with no psychiatric history, for comparison
All patients had lived with schizophrenia for about 17 years on average and were taking medication.
2 Groups, Found Twice
In both hospitals, the program settled on 2 groups as the best fit:
- Disrupted-connection group: 54 patients at the first hospital and 48 at the second
- Near-normal group: 32 patients at the first hospital and 41 at the second
The grouping held up when checked in several ways. Applying the first hospital's groups to the second hospital's patients matched the second hospital's own grouping for about 71% of patients. Splitting each recording in half and regrouping put 75% to 80% of patients back in the same group.
Slow brain rhythms recorded with eyes closed, called theta and alpha waves, did most of the work in separating the 2 groups.
How Different From Healthy Brains?
Patients in the disrupted group showed weaker connections across many brain areas, especially between the left and right sides of regions at the side and back of the brain involved in thinking about oneself and other people.
Patients in the near-normal group differed from healthy volunteers in only a few connections.
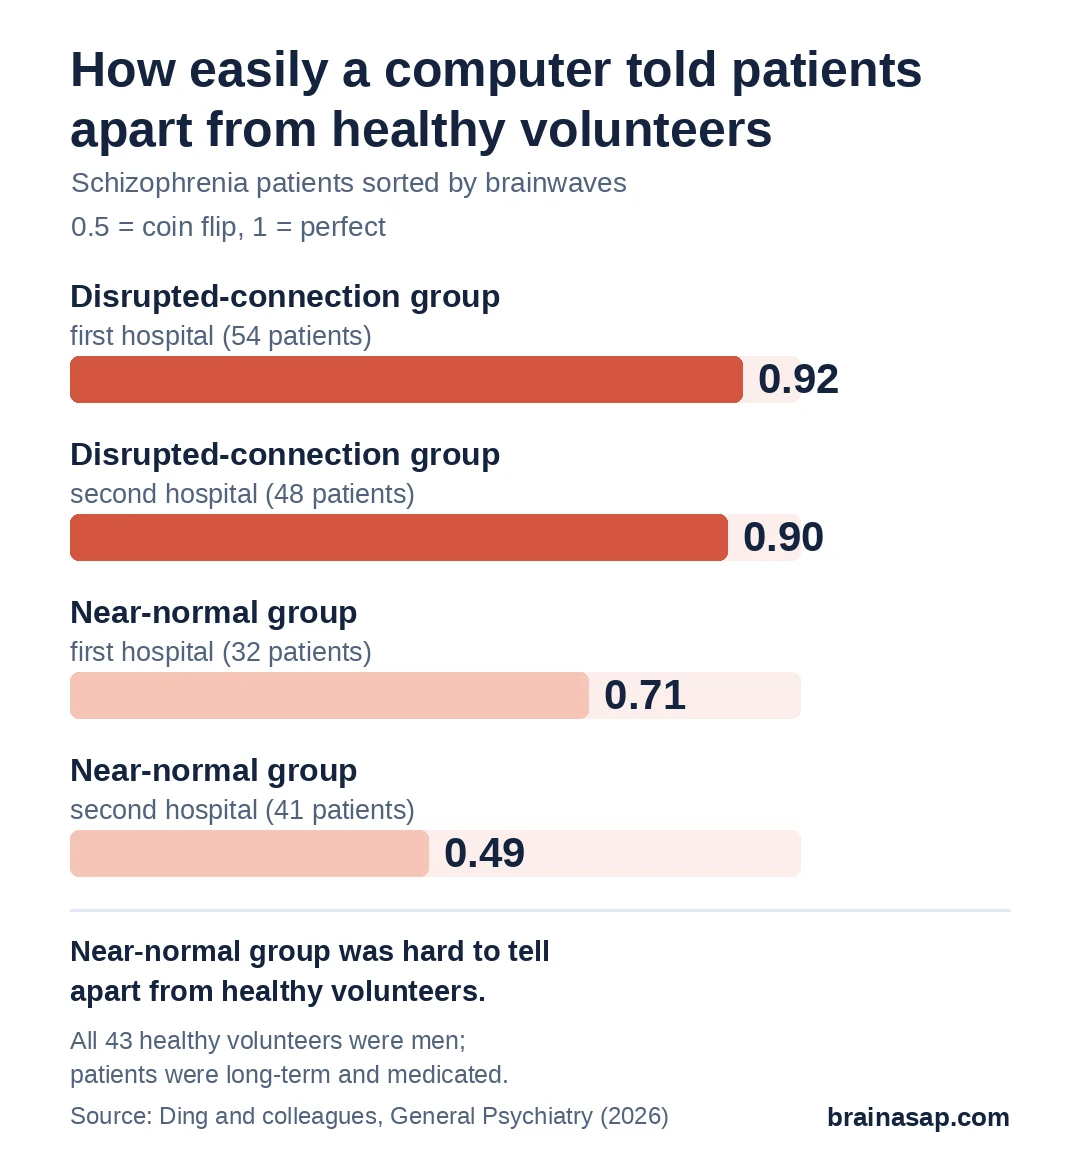
To put a number on it, the team trained a computer to tell each patient group apart from healthy volunteers. It scored 0.92 and 0.90 for the disrupted group, on a scale where 1 is perfect, but only 0.71 and 0.49 for the near-normal group. The scores are AUC values. They measure how well the model ranked patients above volunteers across all thresholds. A value around 0.5 indicates chance-level separation.
Did the Groups Differ in Symptoms?
Not on standard measures. Both groups had similar ages, years of illness, rates of hearing voices and scores on the Positive and Negative Syndrome Scale, a standard interview-based symptom rating.
Within the disrupted group, though, brainwave connections helped predict symptom severity. This link was moderate for negative symptoms, such as withdrawal, flat emotion and low motivation (correlations of 0.45 at the first hospital and 0.35 at the second), and weaker for general symptoms such as anxiety and poor attention.
That pattern did not show up in the near-normal group.
Limits of a First Look
- Long-term, medicated patients only: results may not apply to people with a first episode or no medication
- Medication and smoking not accounted for: drug doses and lifestyle details weren't available for both hospitals
- Male-only comparison group: all 43 healthy volunteers were men, while about a third of patients were women
- No thinking or daily-life tests: it's unknown whether the near-normal group thinks or functions better
- Not a diagnostic test: the exact connections the program relied on varied between hospitals, so this is a research grouping, not a tool for clinics
A Step Toward Sorting Schizophrenia by Biology
This study adds to evidence that schizophrenia is not one uniform brain condition. A relatively cheap EEG cap, used at rest, picked out the same 2 groups in 2 hospitals, and symptom scales alone could not.
A big open question is whether these groups matter in practice, for example whether patients in the near-normal group respond differently to medicine or brain stimulation. Ding and colleagues called for long-term and treatment studies to find out.
Citation: DOI: 10.1002/gps3.70047. Ding Y, Li X, Liu J, Jin G, Tian W, Yuan T, Wu W, Zhou D. Neurophysiological subtyping of schizophrenia reveals a reproducible phenotype with temporoparietal circuit disruptions. General Psychiatry. 2026;39:e70047. PMID: 42713451.
Study Design: Cross-sectional high-density (128-channel) resting-state EEG; source-space power envelope correlations across 31 regions, 5 frequency bands, eyes open and closed; sparse k-means clustering with split-half, cross-cohort projection and in-group proportion checks; support vector machine classification against healthy controls; linear regression on PANSS scores.
Sample Size: 175 adults with chronic schizophrenia (86 discovery, 89 validation) and 43 healthy male controls.
Key Statistic: Subtype 1 (54/48) vs controls AUC 0.92/0.90; Subtype 2 (32/41) vs controls AUC 0.71/0.49; cross-cohort label agreement 70.84%; split-half consistency 80.23% and 75.28%; in Subtype 1, EC theta connectivity predicted negative symptoms r = 0.45 and 0.35.
Caveat: Chronic, medicated patients; antipsychotic dose and smoking not controlled; all-male control group; no cognitive, functional or treatment-response data; template head model; feature selection varied between cohorts.