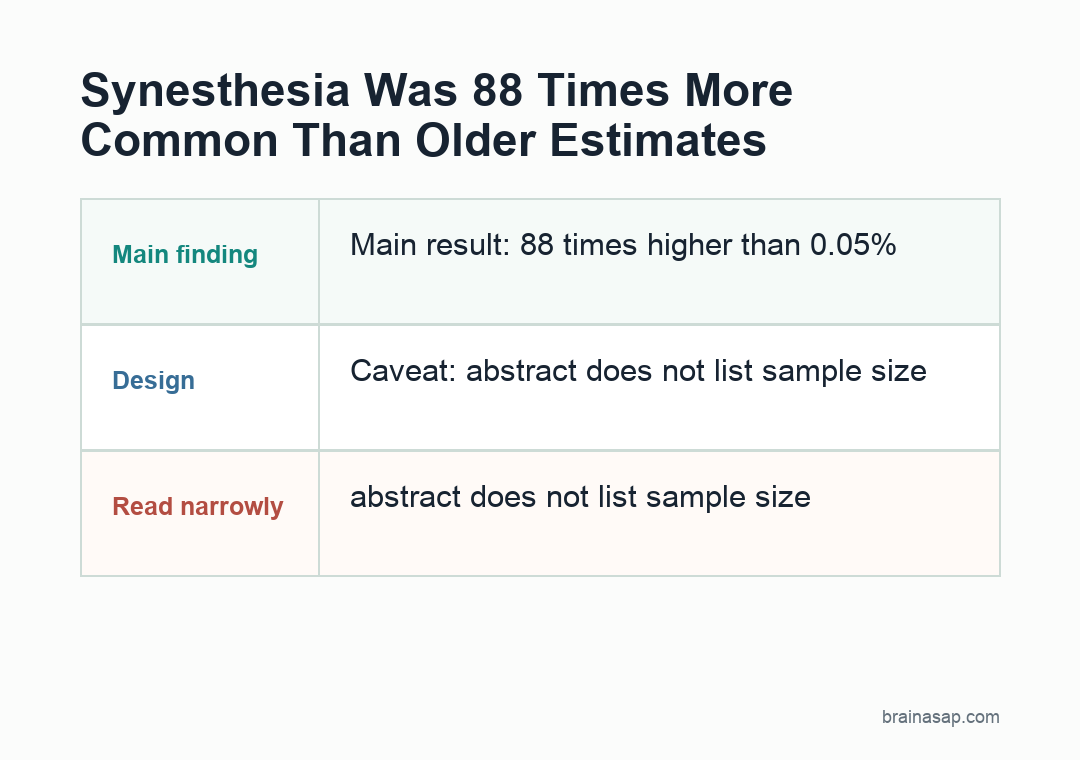
TL;DR: A 2006 study in Perception found that synesthesia was estimated to be 88 times more common than the old 0.05% figure after researchers used non-self-referred sampling and objective consistency tests.
Key Findings
- Older conventional wisdom was about 0.05%: the paper describes that as the prior belief about synesthesia prevalence.
- The prevalence estimate was 88 times higher: authors used sampling that did not rely on people volunteering because they already identified as synesthetes.
- Objective tests checked whether pairings stayed stable: consistency helped tell automatic synesthetic pairings apart from one-off associations or metaphor.
- Colored days were the most common variant: weekdays linked to colors appeared more often than the better-known letter-color form.
- Grapheme-color synesthesia was estimated at 1%: letters or numbers linked to colors were common enough to matter scientifically.
Source: Perception (2006) | Simner et al.
Synesthesia is not just a poetic way to describe music as bright or a name as sharp.
In genuine synesthesia, a stimulus in one domain reliably brings an additional experience in another: a weekday can have a color, a letter may look red or green, or a sound can carry a visual quality.
The 2006 paper by Julia Simner and other researchers attacked two old assumptions at once. First, synesthesia had been treated as extremely rare. Second, earlier reports often suggested a large female bias.
Researchers argued that both conclusions were probably distorted by the way synesthetes were found.
The 0.05% Estimate Made Synesthesia Look Almost Nonexistent
Before this study, one influential view treated synesthesia as extraordinarily rare, around 0.05% of births.
At that rate, the trait would appear in about 1 in 2,000 people: unusual enough to collect case reports, but too rare to tell us much about ordinary perception.
Simner and other researchers challenged that framing.
Their abstract states that they used sampling that did not rely on self-referral.
That is a major methodological shift because self-referral can quietly reshape a sample before the experiment even begins.
The headline arithmetic is striking. If a 0.05% estimate is raised by a factor of 88, the implied prevalence is about 4.4%, or roughly 1 in 23 people.
The exact number depends on definition and testing rules, but the scale of the correction moved synesthesia from “almost never” toward “uncommon but visible in any large population.” If researchers only count people who already know the word “synesthesia,” are comfortable disclosing it, and choose to come forward, the sample becomes a study of visibility as much as perception.
The prevalence result rests on three safeguards:
- Non-self-referred sampling: recruitment did not depend only on people already identifying as synesthetes.
- Objective consistency tests: reported pairings had to remain stable enough to distinguish them from casual association.
- Variant-level counting: the analysis counted colored days and grapheme-color synesthesia separately.
Consistency Tests Checked Whether Monday Stayed the Same Color
Synesthesia research has to handle an awkward problem: the experience is subjective, but the science still needs a way to test whether a report is reliable.
Simner and other researchers addressed that by using objective tests to check whether people’s reported pairings stayed consistent.
The core principle is easy to understand.
If someone says Monday is blue, the scientific test is not whether blue is the “correct” color for Monday.
The test is whether that person gives the same kind of answer over time in a way that casual guessing would not.
This distinction keeps the trait from being reduced to imagination.
Many people can invent a color for a letter if asked, while a synesthete’s pairing tends to arrive automatically and remain stable enough to be measured.
- Casual association: a person can choose a color or image when prompted.
- Synesthetic pairing: the extra experience is automatic and unusually consistent.
- Scientific test: consistency helps turn a private report into measurable evidence.
Colored Days Beat Letter-Color Synesthesia in This Prevalence Test
Popular descriptions of synesthesia often start with grapheme-color experiences: letters or numbers are linked with colors.
The form is easy to explain and has been heavily studied, so it can be treated as the default version of synesthesia.
The 2006 paper found a different prevalence pattern.
Researchers reported that the most common variant was colored days, not grapheme-color synesthesia.
In other words, weekday-color pairings appeared more often than the letter-color form that tends to dominate public examples.
This corrects a real sampling problem.
A field can accidentally overrepresent the form that is easiest to demonstrate, easiest to name, or easiest for researchers to recruit.
Prevalence work has to count the trait as it appears in the population, not only the version with the cleanest classroom example.
Grapheme-Color Synesthesia Reached About 1 in 100 People
The better-known form was not rare in the way older estimates implied.
Simner and other researchers reported grapheme-color synesthesia at 1%, meaning around 1 in 100 people can have stable color experiences linked to letters or numbers under that definition.
A 1% trait is still unusual, but it is not a once-in-a-lifetime anomaly.
In a large school, workplace, or university, there may be several people with this kind of stable cross-modal experience.
It also means the trait can be studied as part of normal human variation.
The goal is not to pathologize people whose perception works differently.
The goal is to understand how brains bind symbols, categories, colors, time, sound, and bodily experience into a coherent world.
The Female Bias Reflected Disclosure More Than Biology
Earlier synesthesia samples often appeared heavily female.
The 2006 paper did not find a strong asymmetry in the distribution of synesthesia across the sexes, and the authors proposed a plain explanation: previous female biases can have come from sex differences in self-disclosure.
Recruitment method can create a false biological pattern.
If one group is more likely to report an unusual internal experience, a self-referred sample can look skewed even when the underlying trait is not.
The lesson for research design is broader than synesthesia.
Whenever a study depends on people volunteering a private experience, the final sample can reflect who notices, names, trusts, reports, and repeats that experience to researchers.
The 88-Fold Revision Put Synesthesia Inside Normal Variation
The paper’s strongest contribution is not that everyone has synesthesia. They do not. Instead, atypical cross-modal perception appears common enough to belong inside mainstream perception science.
Synesthesia shows that perception is not a passive recording of the outside world. Brains bind features together, and the boundaries between senses are not identical in every person.
For one person, a weekday may simply be a word on a calendar. For another, it may arrive with a color that feels stable and immediate.
One person’s perception is not fake simply because another person’s perception lacks the same pairing.
Human perception is less standardized than everyday conversation usually admits.
The 2006 prevalence paper gave that idea numbers: an old 0.05% assumption, an 88-fold revision, colored days as the most common subtype, grapheme-color synesthesia at 1%, and no strong sex asymmetry.
The finding is a cleaner way to talk about synesthesia: uncommon, measurable, stable, and scientifically helpful without being treated as a disorder.
It also gives perception research a larger study population. A trait that appears in several percent of people can be studied with population methods instead of relying mainly on rare case reports.
Citation: DOI: 10.1068/p5469. Simner et al. Synaesthesia: the prevalence of atypical cross-modal experiences. Perception. 2006;35(8):1024-1033
Study Design: Prevalence study using non-self-referral sampling and objective tests for genuineness.
Sample/Model: Non-self-referred prevalence samples; the accessible abstract does not list the full participant count.
Key Statistic: Synesthesia prevalence was reported as 88 times higher than the older 0.05% assumption; grapheme-color synesthesia was estimated at 1%.
Caveat: Single-study evidence; interpret with the source design and sample.