TL;DR: A 2026 mouse study in Nature mapped more than 76,000 single-neuron projections from the orofacial motor cortex (OMC) and found that Alston’s singing mouse, which produces audible song, has 2.8-fold higher OMC connectivity to an auditory cortical region and 3.3-fold higher OMC connectivity to the midbrain periaqueductal grey (PAG) than the laboratory mouse.
Key Findings
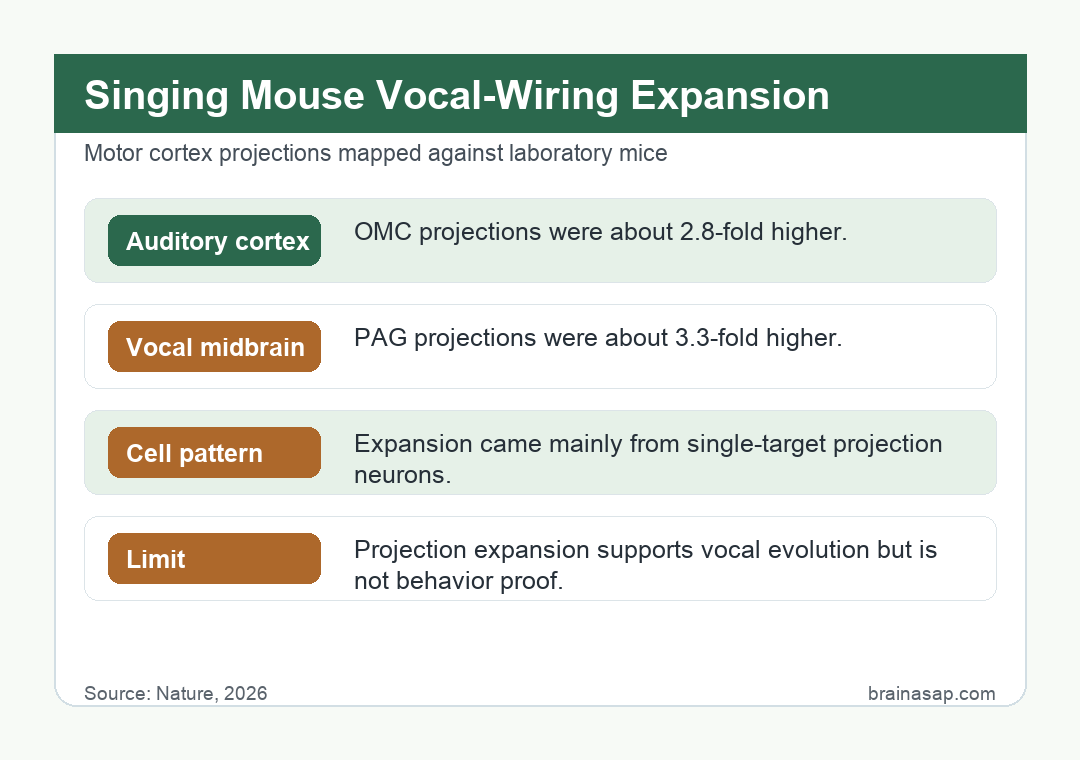
- OMC-to-auditory cortex projections expanded 2.8-fold: 14% of OMC intratelencephalic (IT) neurons in singing mice projected to an auditory cortical region (AudR), compared with 5% in laboratory mice (P = 0.03).
- OMC-to-PAG projections expanded 3.3-fold: 40% of OMC pyramidal tract (PT) neurons in singing mice projected to the midbrain PAG, compared with 12% in laboratory mice (P = 0.03).
- The expansion was selective, not brain-wide: in 9 of 11 brain regions tested (82%), OMC projection probabilities did not differ between species. Only the AudR and PAG showed reliable expansion.
- The extra AudR projections were preferentially “exclusive”: the largest motif expansion in singing mice was OMC neurons that projected to the AudR alone, without collaterals to other cortical or striatal targets (P = 0.003).
- Brain size and gross anatomy were essentially the same: singing and laboratory mouse brains looked nearly identical, suggesting that this behavioral divergence rides on a quantitative rewiring of existing projections rather than on new brain regions.
Source: Nature (2026) | Isko et al.
Singing Mice and Laboratory Mice Diverged About 18 Million Years Ago
Researchers at Cold Spring Harbor Laboratory compared two rodents that share most of their evolutionary history but produce very different vocalizations.
Alston’s singing mouse (Scotinomys teguina) is a Central American cricetid that produces loud, stereotyped, human-audible songs and uses them for back-and-forth turn-taking with other singing mice.
The laboratory mouse (Mus musculus) makes only ultrasonic vocalizations and does not show this turn-taking behavior.
The two species split roughly 18 million years ago.
Their brains are similar in gross morphology, which made them a good test bed for asking whether behavioral novelty in mammals comes from new brain regions or from rewiring of existing ones.
An earlier line of work from the same group had identified the orofacial motor cortex (OMC) as the cortical region that controls singing.
Electrical stimulation of the OMC paused ongoing songs, silencing OMC activity with the GABA-A agonist muscimol disrupted turn-taking, and focal cooling lengthened songs.
The OMC was therefore the natural starting point for asking what changed in the wiring diagram.
Bulk Tracing and MAPseq Mapped OMC Wiring at Two Resolutions
Researchers used two complementary techniques:
- Bulk axonal tracing: AAV2.9-CaMKII-tdTomato was injected into the OMC of 3 singing and 3 laboratory mice, and serial two-photon tomography (STPT) imaged whole-brain fluorescence. This produced a population-level map of where OMC neurons sent their axons in each species.
- MAPseq (Multiplexed Analysis of Projections by Sequencing): a barcoded Sindbis virus library tagged thousands of OMC neurons with unique RNA barcodes. Target regions were dissected and the barcode counts in each region revealed the projection pattern of each individual neuron.
MAPseq recovered more than 76,000 single-neuron projection patterns across 12 mice (5,114 neurons from 7 singing mice and 71,704 neurons from 5 laboratory mice).
The team confirmed that barcode expression per neuron was similar across species and that the recovered neurons fell into the three expected excitatory cortical classes:
- Intratelencephalic (IT) neurons: project within the cortex and to the striatum.
- Corticothalamic (CT) neurons: project from cortex to thalamus.
- Pyramidal tract (PT) neurons: project from cortex to midbrain and hindbrain.
Two Brain Regions Were Selectively Wired Up in the Singing Mouse
The bulk tracing maps looked qualitatively similar across species. OMC neurons in both mice targeted the same downstream regions, with no obviously novel projections in either species.
The quantitative comparison of MAPseq data told a different story. Out of 11 target regions tested, 9 showed no significant difference in projection probability between species. Two regions stood out:
- Auditory cortex region (AudR): 5% of OMC IT neurons in laboratory mice projected to the AudR, compared with 14% in singing mice. That is a 2.8-fold expansion (P = 0.03, Mann-Whitney U-test).
- Midbrain periaqueductal grey (PAG): 12% of OMC PT neurons in laboratory mice projected to the PAG, compared with 40% in singing mice. That is a 3.3-fold expansion (P = 0.03, Mann-Whitney U-test).
Both regions have well-documented roles in vocal behavior.
In rodents, silencing the PAG blocks ultrasonic vocalization and activating it can drive vocalization, and lesions to the PAG cause mutism across many species.
The AudR overlaps with a temporal association area that has been linked to socially motivated maternal behavior in laboratory mice and to reciprocal connections with motor cortex.
Validation experiments backed up the result.
STPT volumes in the same animals confirmed expanded fluorescent signal in the AudR and PAG, but not in two negative-control regions (the contralateral OMC and the substantia nigra).
A synaptophysin-mRuby virus showed that OMC axons in the AudR and PAG carried synaptic boutons, ruling out passing fibers.
Anterograde trans-synaptic mapping confirmed downstream postsynaptic neurons.
The AudR Expansion Came From Single-Target, Not Multi-Target, Neurons
Population-level projection probability does not say whether the extra projections came from neurons that added the AudR to a long list of targets (more collaterals) or from neurons that projected only to the AudR (more dedicated channels).
Researchers used the MAPseq motif structure to tell these models apart. For each OMC IT neuron, they listed every region it projected to.
With three target choices, each neuron could fall into one of seven possible projection motifs. They then asked which motifs were enriched in singing mice.
The biggest expansion was for OMC neurons that projected to the AudR exclusively, with no collaterals to the contralateral OMC or the striatum (P = 0.003, Mann-Whitney U-test).
Two other AudR-containing motifs were also enriched in singing mice (P = 0.010 each).
A simple binomial wiring model that assumed each neuron picks its targets independently fit most of the laboratory mouse data, but it failed in singing mice (P < 0.001, F-test).
The mismatch was concentrated in the exclusive AudR motif.
That wiring result is consistent with the parcellation hypothesis from comparative neuroanatomy, in which behaviorally relevant projections become more specialized over evolutionary time by reducing collaterals.
Sex Did Not Drive the Effect, and Both Methods Agreed:
Researchers checked whether the expanded projections were a male trait, since song duration in singing mice is sensitive to circulating androgens.
Both male and female singing mice produced songs with overlapping loudness and rate distributions.
Both male and female singing mice also showed expanded OMC projections compared with their same-sex laboratory mouse counterparts.
The MAPseq result also held when researchers varied analytic choices (such as the unique molecular identifier threshold used to call a neuron present in a region) and when they checked viral infectivity differences between species.
The agreement between bulk tracing, MAPseq, and synaptic-bouton confirmation made the projection expansion hard to explain as a technical artifact.
Method-Driven Limits and What This Result Cannot Yet Explain
Study authors named several constraints on what the result settles:
- Anatomical, not causal: the study mapped wiring differences but did not test whether silencing the expanded OMC-AudR or OMC-PAG projection in singing mice would disrupt singing behavior. Causal manipulations are flagged as the next step.
- Brain regions must be alignable: MAPseq depends on dissecting the same target regions in both species. Areas that lack reliable anatomical markers across species cannot be tested with this approach.
- Two species, not the full clade: singing mice and laboratory mice diverged a long time ago, and the analysis did not include intermediate cricetid species (such as the closely related Chiriqui singing mouse or the pygmy mouse) that could anchor the timing of the expansion.
- Other layers of change were not measured: the larynx of singing mice has a physically expanded ventral pouch that lowers their vocal pitch. Genetic, molecular, and cell-type changes in the OMC were also not characterized in this study.
- Developmental mechanism is open: the data describe the adult wiring pattern but not the developmental program that produces it. Spatial transcriptomics across cortical development would be needed to distinguish duplication-divergence and other models of long-range projection evolution.
Selective OMC Projection Expansion Could Support Vocal Evolution
The big-picture argument is methodological.
The two species look almost identical in brain size, gross anatomy, and overall cortical organization, yet they differ behaviorally in a striking way that depends on a single cortical region.
The MAPseq comparison shows that a small number of selectively expanded projection motifs can accompany a major behavioral innovation.
For vocal communication, the specific projections that expanded line up with what would be helpful for singing.
An OMC-to-PAG projection could give cortex a stronger handle on the brainstem note generator, while an OMC-to-AudR projection could help an animal predict and gate its own auditory feedback during loud song.
Researchers framed both expansions as candidate substrates for hierarchical motor control of vocal output and for self-monitoring during vocal production, processes that comparative neurobiologists treat as preadaptations for human language.
The broader claim is that this comparative MAPseq strategy can be applied to other recently diverged species pairs with large behavioral differences.
The question of how rapidly cortex can be re-tuned to support a new behavior is now testable at single-neuron resolution.
Citation: DOI: 10.1038/s41586-026-10458-y. Isko et al. Specific expansion of motor cortical projections in a singing mouse. Nature. 2026.
Study Design: Comparative neural circuit anatomy. Bulk axonal tracing with AAV2.9-CaMKII-tdTomato; serial two-photon tomography; MAPseq barcoded projection mapping with a Sindbis virus library; validation with synaptophysin-mRuby and anterograde trans-synaptic mapping.
Sample Size: 12 mice total (7 Alston’s singing mice, 5 laboratory mice); more than 76,000 single-neuron projection patterns from the orofacial motor cortex.
Key Statistic: 2.8-fold increase in OMC IT projection probability to AudR (5% vs 14%, P = 0.03) and 3.3-fold increase in OMC PT projection probability to PAG (12% vs 40%, P = 0.03) in singing mice compared with laboratory mice.
Caveat: Anatomical comparison only; no causal manipulation of the expanded projections; molecular and developmental mechanisms were not characterized; intermediate species in the clade were not sampled.