TL;DR: A county-level 2026 study in PLOS One found that warmer monthly temperatures in the United States from 2013 to 2024 were associated with higher police-violence death rates, with projected additional deaths by 2050 under high-emissions climate scenarios.
Key Findings
- 2013-2024 county-level data: Researchers linked U.S. police-violence deaths with monthly temperature and precipitation data across counties.
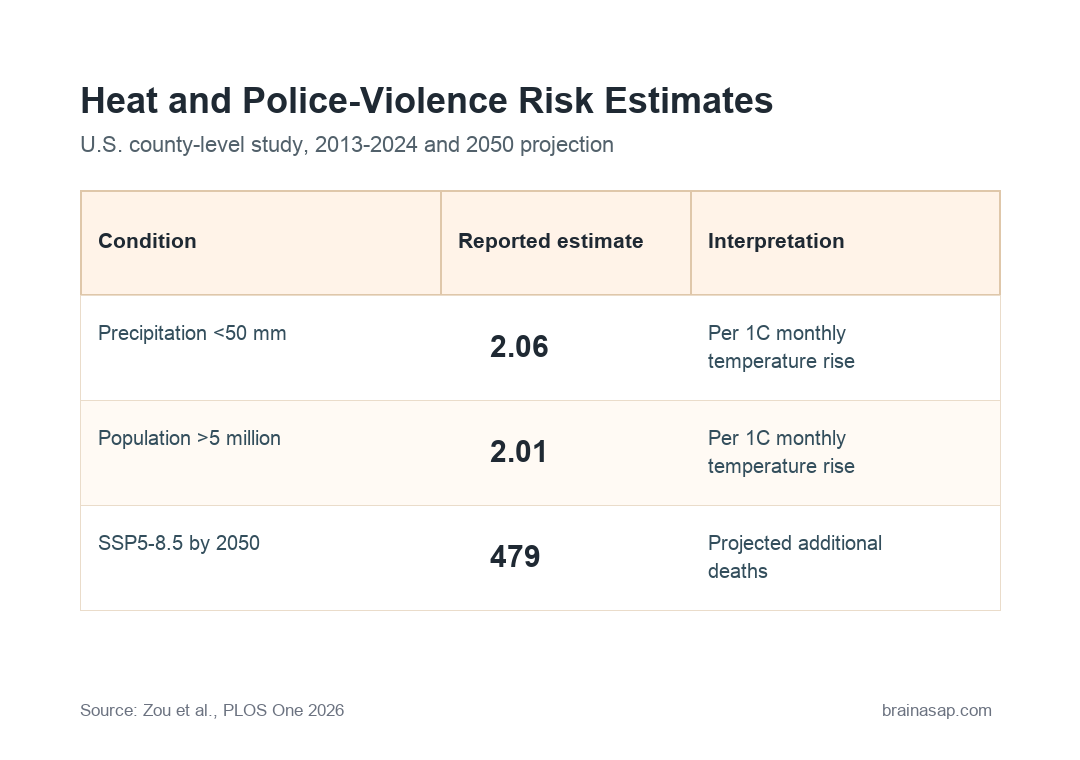
- 1°C temperature increase: In counties with less than 50 mm precipitation, each 1°C rise in monthly average temperature was associated with 2.06 additional police-violence deaths per unit of the modeled death rate (95% CI: 0.92-3.20).
- Large-population counties: In counties with populations above 5 million, each 1°C rise was associated with a 2.01 increase in the modeled death rate (95% CI: 1.08-2.93).
- Spatiotemporal variation: Estimated heat-related risk varied by state and time, with elevated risks in some high-temperature states and especially during 2024.
- 2050 projection: Under SSP5-8.5, the highest greenhouse-gas emissions scenario, researchers projected 479 cumulative additional police-violence deaths by 2050 (95% CI: 183-836).
Source: PLOS One (2026) | Zou et al.
Heat exposure has been linked to aggression, violence, suicide, crime, and other public-health outcomes in earlier research. The analysis tested whether lethal police violence followed a similar temperature-risk pattern.
The outcome was lethal police violence, not complaints, arrests, or nonfatal force. That endpoint is narrower than overall police contact, but it captures the most severe outcome.
Temperature and Police-Violence Deaths Were Matched by County
Researchers used nationwide U.S. data from January 1, 2013, through December 31, 2024, and linked police-violence deaths with county-level monthly temperature and precipitation measures.
The statistical approach used panel regression models with high-dimensional fixed effects. In practical terms, that design helps control for stable differences between counties and broader time patterns that could otherwise confound a heat-violence association.
The main exposure was monthly average temperature. They also examined whether precipitation, population size, geography, and time changed the estimated temperature effect.
That structure is useful for a public-health question because counties differ in baseline risk, climate, population density, law-enforcement systems, and reporting conditions. Fixed effects cannot solve every bias problem, but they reduce the chance that the analysis is only comparing hot counties with cold counties.
- Exposure: Monthly average ambient temperature at the county level.
- Outcome: Deaths from police violence in the United States.
- Modifiers: Precipitation, population size, state-level patterns, year, and climate projections.
Warmer Months Were Associated With Higher Police-Violence Risk
The overall pattern was positive: warmer temperatures corresponded to higher modeled risk of police-violence deaths. The paper does not claim that temperature is the only driver or that heat directly causes every incident.
This distinction is central. A monthly county-level association can support planning and surveillance, but it cannot show what happened inside any single police encounter.
Heat may still be operationally relevant. Hotter conditions can affect sleep, irritability, outdoor activity, alcohol use, emergency-call patterns, and stress during public interactions, all of which could plausibly change violence risk.
The clearest estimates came from heterogeneity analyses. In counties with less than 50 mm of precipitation, each 1°C rise in monthly average temperature was associated with a 2.06 increase in the modeled police-violence death rate, with a 95% confidence interval of 0.92 to 3.20.
Population size also changed the association. In counties with more than 5 million residents, each 1°C temperature increase was associated with a 2.01 increase in the modeled death rate, with a 95% confidence interval of 1.08 to 2.93.
Precipitation and Population Size Changed the Heat Association
The precipitation result is important because temperature does not occur in isolation. Heat, humidity, rainfall, outdoor activity, and policing patterns can interact in ways that change exposure and risk.
Lower precipitation may mark conditions where heat exposure is more behaviorally relevant, though the paper does not prove the mechanism. It could reflect more outdoor activity, different public-space conditions, or other regional factors.
The population-size finding also has a practical interpretation. Large counties contain more police-public encounters, more heat-exposed residents, and more complex urban environments.
Small changes in risk can therefore become more consequential at the population level.
- Low precipitation: The temperature association was stronger when monthly precipitation was below 50 mm.
- Large population: Counties above 5 million residents showed a stronger temperature-risk estimate.
- Local planning: Heat-risk mitigation may need to account for both weather and policing context.
2024 and Some High-Temperature States Had Higher Estimated Risk
The researchers reported notable spatiotemporal variation. Heat-related police-violence risk was not identical across the country or across the study period.
Some states with high temperature exposure showed elevated risk estimates. The year 2024 also stood out, which is relevant because 2024 was globally the hottest year on record and the first calendar year to exceed 1.5°C above pre-industrial levels.
This kind of variation is expected in environmental health research. Temperature effects often depend on infrastructure, local adaptation, baseline climate, social conditions, and institutional practices.
Climate Projections Estimated Additional Deaths by 2050
The study also projected future risk under climate scenarios. Under SSP5-8.5, the highest greenhouse-gas emissions scenario used in the paper, researchers estimated 479 cumulative additional deaths from police violence by 2050 due to expected temperature change.
The uncertainty interval was wide: 183 to 836 additional deaths. That range is important because climate projections, future policing patterns, population shifts, and intervention choices can all change the estimate.
The public-health interpretation is not that warming mechanically produces a fixed number of deaths. It is that heat may add risk to an already severe violence problem unless institutions adapt.
Adaptation could include heat-aware staffing, de-escalation priorities during heat waves, stronger behavioral-health response options, cooling-center coordination, and closer monitoring of high-risk periods. Those interventions were not tested here, but the association gives planners a reason to include policing and crisis response in heat-risk discussions.
The Main Caveat Is That This Is an Association Study
This is a county-month observational analysis. It can show that warmer temperatures were associated with higher police-violence death rates after statistical adjustment, but it cannot identify the exact psychological, behavioral, or institutional mechanism behind the association.
Police violence is shaped by many factors: law-enforcement policy, racism, firearm prevalence, mental-health crisis response, poverty, neighborhood conditions, training, accountability systems, and emergency-call patterns. Temperature is one possible additional risk factor within that larger system.
For brain and behavior readers, the heat pathway is plausible but not settled. Prior studies link heat to aggression and violence, but this paper did not measure stress physiology, decision-making, call type, crowding, officer behavior, or civilian behavior directly.
- Ecological design: County-level results should not be treated as individual-level proof about any specific encounter.
- Mechanism limit: The study does not show whether heat changes public behavior, officer behavior, call volume, or institutional response.
- Projection limit: 2050 estimates depend on climate scenarios and future social conditions.
The practical takeaway is direct: extreme heat planning should include violence prevention, crisis response, and policing systems, not only heat stroke and hospital demand.
For local agencies, the immediate value is not prediction of individual events. It is identifying periods when heat may add pressure to systems that already need safer response options.
Citation: DOI: 10.1371/journal.pone.0345523; Zou J, Hou K, Xu X, Wang Z; Higher temperatures are associated with increased risk of police violence: A nationwide county-level study in the United States, 2013-2024; PLOS One; 2026;21(3):e0345523.
Study Design: Nationwide county-level panel regression study linking monthly temperature, precipitation, and police-violence deaths in the United States.
Sample Size: County-month data from January 1, 2013, to December 31, 2024, across the United States.
Key Statistic: Under SSP5-8.5, projected cumulative additional police-violence deaths by 2050 were 479 (95% CI: 183-836).
Caveat: Observational ecological design; results estimate association and projected burden, not individual-level causation.