TL;DR: A 2026 Nature Neuroscience study used cross-species functional MRI (fMRI) connectivity to identify hypoconnectivity and hyperconnectivity autism subtypes linked to different synaptic and immune-related biological pathways.
Key Findings
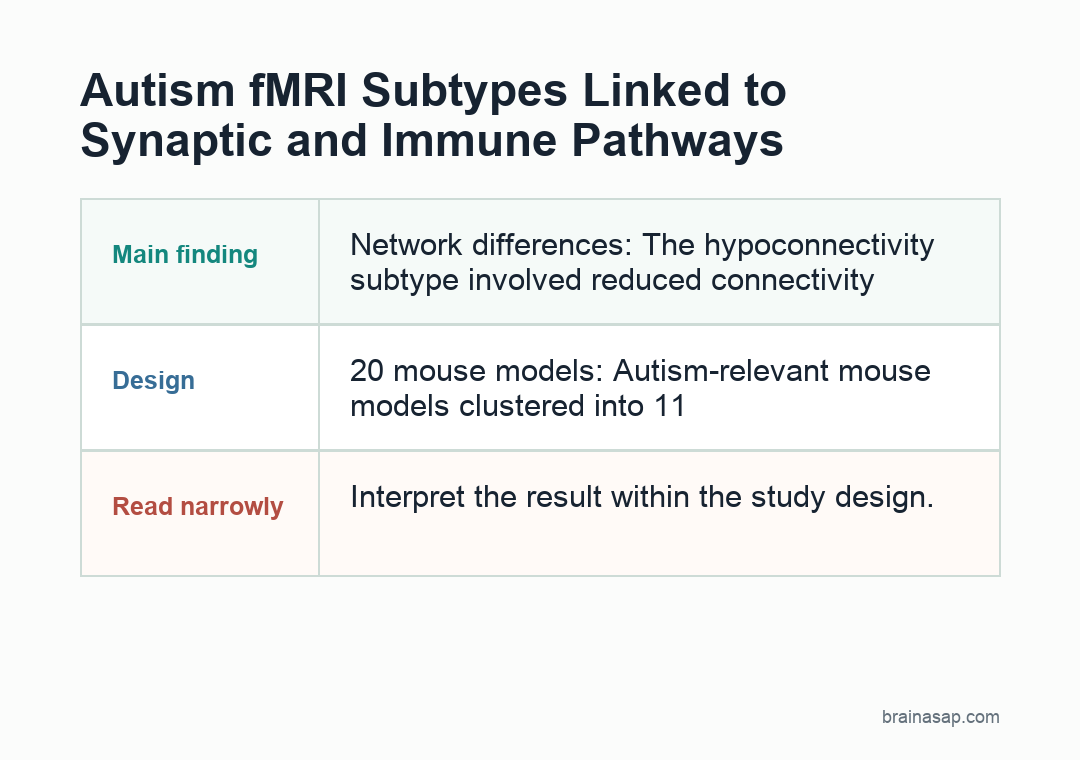
- 20 mouse models: Autism-relevant mouse models clustered into 11 hypoconnectivity-dominant and 9 hyperconnectivity-dominant fMRI patterns.
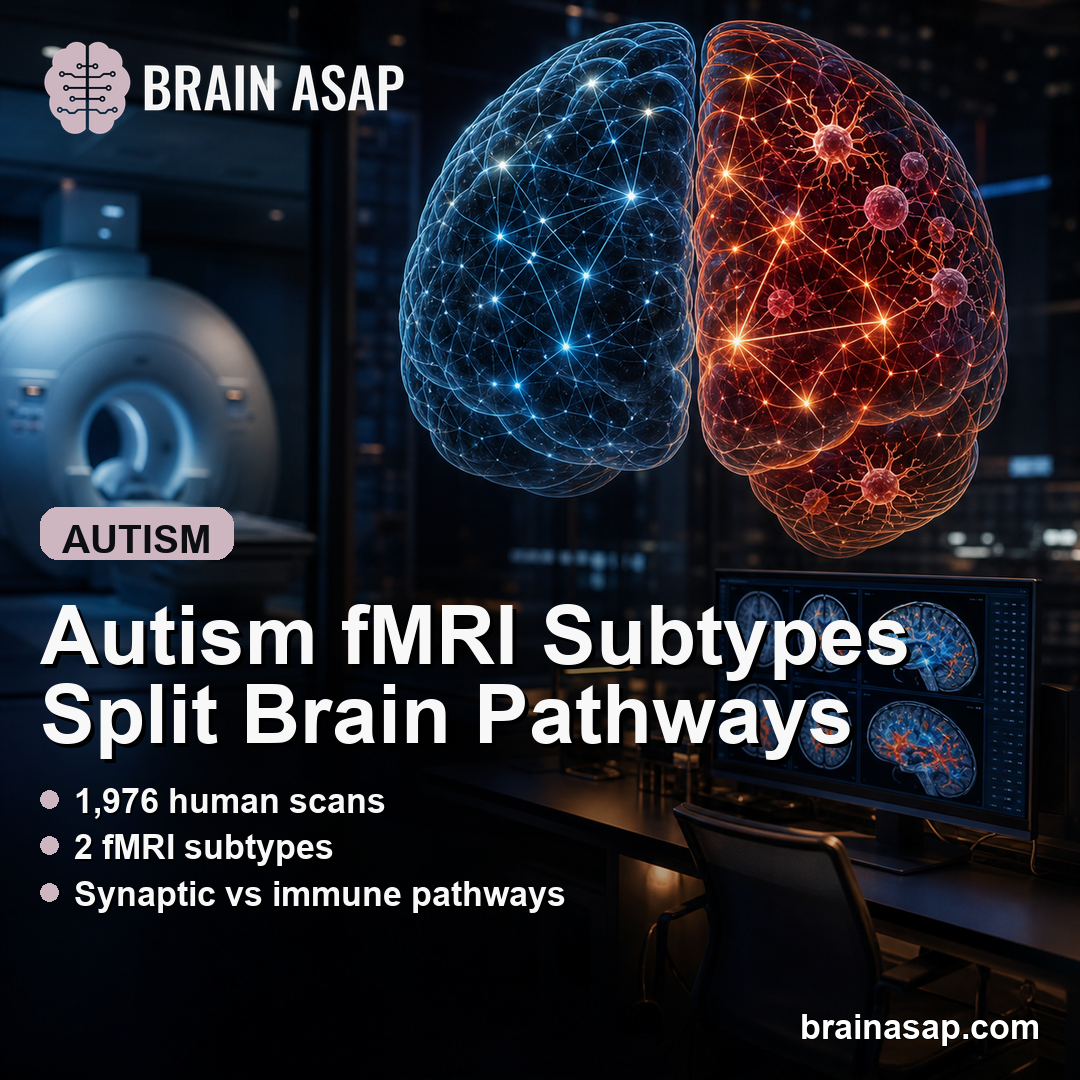
- 1,976 human scans: The human dataset included 940 autistic individuals and 1,036 neurotypical controls across 38 data collections.
- 25.1% subtyped: Across the aggregated autism sample, 74 people fit the hypoconnectivity subtype and 162 fit the hyperconnectivity subtype.
- Synaptic pathway link: The hypoconnectivity subtype was enriched for synaptic genes and pathways in mouse and human analyses.
- Immune pathway link: The hyperconnectivity subtype was enriched for immune-related pathways, including cytokine signaling and microglia-related modules.
Source: Nature Neuroscience (2026) | Pagani et al.
Autism spectrum disorder is clinically heterogeneous: language, cognition, social communication, restricted behaviors, motor features, and adaptive functioning can vary widely across people with the same diagnosis.
This study tested whether some of that heterogeneity also appears as biologically meaningful brain-connectivity subtypes. The researchers used mouse models to guide the search in human fMRI data rather than clustering human scans alone.
Mouse Autism Models Split Into Hypoconnectivity and Hyperconnectivity
The first analysis used resting-state fMRI from 20 autism-relevant mouse models. Each model had wild-type control littermates, which helped isolate connectivity changes tied to the modeled genetic or immune-related autism risk factor.
The mouse models did not show 1 shared autism connectivity map. Instead, hierarchical clustering separated them into 2 dominant patterns: hypoconnectivity, where mutant mice showed lower functional connectivity, and hyperconnectivity, where they showed higher connectivity.
- Hypoconnectivity cluster: 11 mouse models, including Shank3, 22q11.2, 16p11.2, Ube3a, and Sgsh models.
- Hyperconnectivity cluster: 9 mouse models, including Fmr1, Chd8, Tsc2, Il-6, and Cdkl5 knockout models.
- Network differences: The hypoconnectivity subtype involved reduced connectivity among salience, default mode, and hippocampal networks, while the hyperconnectivity subtype involved limbic, salience, and subcortical increases.
The 2 mouse patterns had little spatial overlap, which supports the idea that they were not just weaker and stronger versions of the same result.
Human fMRI Data Reproduced the 2 Connectivity Subtypes
The human analysis used low-motion resting-state fMRI data from 940 autistic individuals and 1,036 neurotypical controls. Ages ranged from 5 to 30 years, and the dataset drew heavily from ABIDE collections plus a Child Mind Institute sample.
The researchers split the human dataset into discovery and replication samples before subtyping. The discovery dataset contained 744 autistic individuals, and the replication dataset contained 196.
- Discovery sample: 744 autistic individuals and 807 neurotypical controls were used to identify the subtype maps.
- Replication sample: 196 autistic individuals and 229 neurotypical controls tested whether the maps reproduced.
- Site coverage: The full human dataset came from 38 data collections across 23 sites, reducing dependence on 1 scanner or cohort.
Across the combined autism sample, the method identified 74 people with the hypoconnectivity subtype and 162 people with the hyperconnectivity subtype. Together, those groups accounted for 25.1% of the autistic participants.
Replication was stronger for the hyperconnectivity subtype, with Dice coefficient 0.96 and connectivity-profile correlation r = 0.70. The hypoconnectivity subtype also replicated, with Dice coefficient 0.74 and r = 0.67.
Hypoconnectivity Was Linked to Synaptic Pathways
Pathway analysis connected the hypoconnectivity subtype to synaptic biology. In mouse models, the hypoconnectivity interactome was enriched for synaptic functioning, chemical synapse transmission, protein-protein interaction at the synapse, membrane trafficking, and related plasticity pathways.
The human gene-decoding analysis pointed in the same direction. Brain-decoded genes for the hypoconnectivity subtype were enriched for synaptic ontologies, including transmission across chemical synapses and SynGO synaptic genes.
- Mouse synaptic enrichment: SynGO enrichment reached OR = 5.32 with PFDR = 10^-42.
- Human synaptic enrichment: SynGO enrichment reached OR = 2.19 with PFDR = 10^-14.
- Postmortem module check: Synaptic vesicles and plasticity modules replicated in the hypoconnectivity subtype.
This synaptic enrichment does not diagnose a specific gene mutation in an individual person. It suggests that 1 reproducible connectivity subtype is more aligned with synaptic dysfunction than with immune-dominant biology.
Hyperconnectivity Was Linked to Immune and Microglial Pathways
The hyperconnectivity subtype showed a different biological profile. In mouse analyses, it was enriched for immune-related pathways such as cytokine signaling, innate immune response, adaptive immune response, chromatin organization, and transcriptional mechanisms.
Human gene decoding again supported the cross-species split. The hyperconnectivity subtype was enriched for cytokine signaling, innate immune system function, and postmortem modules related to immune response and reactive microglia.
- Mouse cytokine signaling: OR = 7.83, PFDR = 10^-39.
- Human cytokine signaling: OR = 1.66, PFDR = 10^-3.
- Reactive microglia module: Human postmortem-module analysis reported OR = 1.79, PFDR = 10^-2.
The hyperconnectivity subtype also showed moderately higher ADOS-2 total calibrated severity scores than the hypoconnectivity subtype. The difference appeared mainly in social-affect scores, not restricted and repetitive behavior scores.
Autism Subtyping Still Covered Only Part of the Spectrum
The strongest interpretation is not that autism has only 2 biological forms. The identified subtypes covered about 1 in 4 autistic participants in the aggregated fMRI dataset, leaving most scans outside those 2 dominant patterns.
- Subset finding: 74 hypoconnectivity and 162 hyperconnectivity cases were identified among 940 autistic individuals.
- Imaging dependency: The method depends on resting-state fMRI quality, motion control, and cross-site harmonization.
- Clinical translation: The subtypes are not yet treatment-selection tools or diagnostic categories.
The value is a framework: mouse models can help decode human autism imaging patterns into subtypes with plausible biological backing. Larger prospective studies would need to test whether these subtypes predict development, treatment response, or clinically useful outcomes.
Citation: DOI: 10.1038/s41593-026-02287-z. Pagani et al. Autism subtypes identified using cross-species functional connectivity analyses. Nature Neuroscience. 2026;29:1476-1487.
Study Design: Cross-species functional neuroimaging and gene-enrichment analysis using autism mouse models and multicenter human resting-state fMRI data.
Sample Size: 20 autism-relevant mouse models, 940 autistic individuals, and 1,036 neurotypical controls.
Key Statistic: Human subtyping identified hypoconnectivity in 74 autistic participants and hyperconnectivity in 162, together covering 25.1% of the autism sample.
Caveat: These are research subtypes, not clinical diagnostic labels, and most autistic participants were not assigned to either subtype.