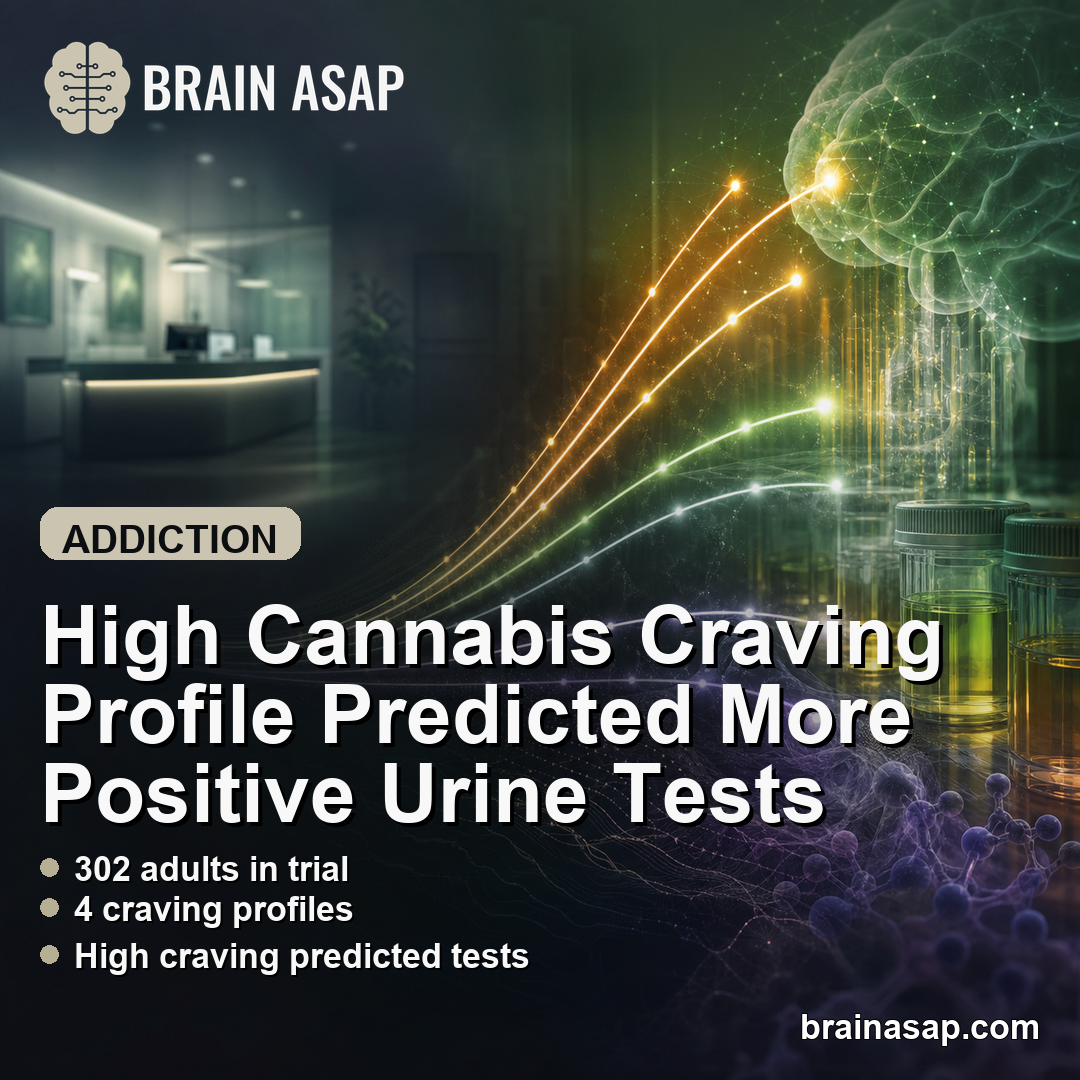
TL;DR: A 2026 secondary analysis in Drug and Alcohol Dependence found 4 cannabis craving trajectories during treatment, with the high-craving group showing more positive urine cannabinoid tests and higher baseline anxiety, depression, and obsessive-compulsive cannabis-use symptoms.
Key Findings
- Trial reanalysis: Researchers reanalyzed a 12-week multisite cannabis use disorder trial of 302 adults assigned to N-acetylcysteine or placebo.
- 4 craving classes: The best-fitting model identified low craving, moderate-decreasing craving, moderate-stable craving, and high craving groups.
- 41% low craving: The largest group started lower and declined to a mean MCQ-SF craving score of 16.0 by week 4.
- 10% high craving: The smallest group started with very high craving, with a mean baseline MCQ-SF score of 72.5.
- 96% positive tests: The high-craving class had the highest proportion of positive urine cannabinoid tests and the lowest test completion rate.
Source: Drug and Alcohol Dependence (2026) | Alias-Ferri et al.
Cannabis craving is not just a background symptom in cannabis use disorder. It can affect treatment engagement, return to use, and the amount of extra support a patient may need during a quit attempt.
This study asked whether craving during treatment follows a single average decline or separates into different trajectories that can identify higher-risk patients.
Researchers Reanalyzed a Cannabis Treatment Trial With Repeated Craving Scores
The analysis used data from the ACCENT trial, a National Drug Abuse Treatment Clinical Trials Network study that tested N-acetylcysteine, or NAC, against placebo in adults with cannabis use disorder.
The original trial enrolled 302 adults across six US sites. Participants were randomized to 1200 mg NAC twice daily or placebo for 12 weeks, and all participants received contingency management.
- Treatment length: Craving was tracked during a 12-week treatment period and again at a 5-week post-treatment follow-up.
- Craving measure: Researchers used the Marijuana Craving Questionnaire-Short Form, or MCQ-SF, scored from 12 to 84.
- Cannabis outcome: Urine cannabinoid testing occurred twice weekly during treatment and follow-up.
- Modeling approach: Latent class growth analysis grouped people by craving trajectories over time.
The trajectory model added information that baseline scores alone did not provide. Both moderate-craving groups started similarly but separated over time.
4 Cannabis Craving Trajectories Fit the Data Best
The best-fitting solution identified 4 craving classes. Fit statistics supported the model, including AIC of 17,730, BIC of 17,823, a VLMR p value of 0.0046, and entropy of 0.868.
The classes were clinically distinct rather than just statistical labels. They described low, improving, persistent, and high craving patterns.
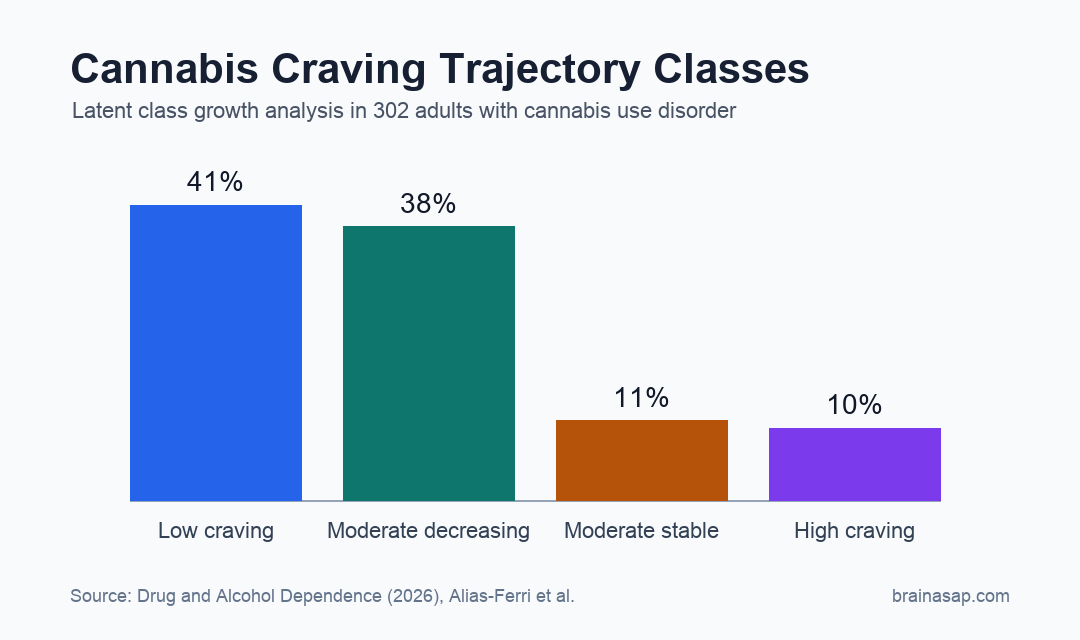
- Low craving: 123 participants, or 41%, began with the lowest mean craving score and declined further by week 4.
- Moderate-decreasing craving: 116 participants, or 38%, started at a moderate score and declined sharply early in treatment.
- Moderate-stable craving: 33 participants, or 11%, started similarly to the moderate-decreasing class but improved less.
- High craving: 30 participants, or 10%, began with very high craving and showed only modest improvement.
The contrast between the moderate groups is clinically relevant. Similar starting scores can lead to different treatment courses, so repeated craving checks may add information that a single intake score misses.
High Craving Tracked With Anxiety, Depression, and Cannabis-Use Compulsivity
Several baseline mental health measures differed by craving class. The low-craving class had lower anxiety, depression, and obsessive-compulsive drug-use scores than the higher-craving classes.
For anxiety, the low-craving class had a mean Hospital Anxiety and Depression Scale anxiety score of 5.0. The moderate-decreasing, moderate-stable, and high-craving classes were all higher, at about 7.3 to 7.4.
Depression followed a similar direction. The low-craving group averaged 2.8, while the high-craving group averaged 5.5. The authors noted that depression differences were statistically significant but generally remained in a nonclinical range.
- Anxiety scores: Higher craving classes had anxiety scores closer to borderline or clinically meaningful ranges.
- Depression scores: Higher craving classes had higher depression scores, though average scores were still low clinically.
- OCDUS scores: Obsessive-compulsive cannabis-use symptoms were highest in the high-craving group, with a mean score of 28.4.
These baseline mental health differences were associated with craving class, not tested as causes. Persistent cannabis craving may be harder to treat when anxiety and compulsive-use features are active at baseline.
The High-Craving Group Had the Poorest Urine Testing Pattern
The urine cannabinoid results moved in the same direction as the craving trajectories. The low-craving class had the lowest proportion of positive tests, while the high-craving class had the highest.
The high-craving class had a mean positive-test proportion of 0.96. It also had the lowest number of completed urine tests, which complicates interpretation because missed tests can reflect disengagement, continued use, or both.
- Low-craving outcome: Mean proportion of positive urine tests was 0.71.
- High-craving outcome: Mean proportion of positive urine tests was 0.96.
- Testing completion: The high-craving class completed fewer urine tests than the other classes.
Persistent high craving may identify a group that needs faster treatment adjustment, more intensive craving-management work, or closer follow-up.
Dynamic Craving Checks May Personalize Cannabis Treatment
The study supports repeated craving assessment during treatment rather than relying only on baseline severity. A patient whose craving does not fall early may need a different treatment plan than a patient whose craving declines quickly.
Possible add-ons include cognitive-behavioral craving-management strategies, mindfulness-based relapse prevention, or other supports that address anxiety and mood symptoms alongside cannabis use.
The main limitation is that this was a secondary analysis of an older trial. The data can identify trajectories and associations, but it cannot prove that changing craving trajectories will directly improve abstinence.
For clinical monitoring, cannabis craving was heterogeneous, measurable over time, and tied to meaningful treatment-outcome differences.
Citation: DOI: 10.1016/j.drugalcdep.2026.113208. Alias-Ferri et al. Longitudinal Craving Profiles in Cannabis Use Disorder: A Latent Class Growth Analysis of the Achieving Cannabis Cessation: Evaluating N-Acetylcysteine Treatment (ACCENT) (CTN-0053) Trial. Drug and Alcohol Dependence. 2026;285:113208.
Study Design: Secondary latent class growth analysis of a multisite randomized cannabis use disorder treatment trial.
Sample Size: 302 adults with cannabis use disorder.
Key Statistic: 4 craving classes were identified: 41% low, 38% moderate-decreasing, 11% moderate-stable, and 10% high craving.
Caveat: The analysis shows trajectory-outcome associations, not proof that changing craving trajectories causes better outcomes.