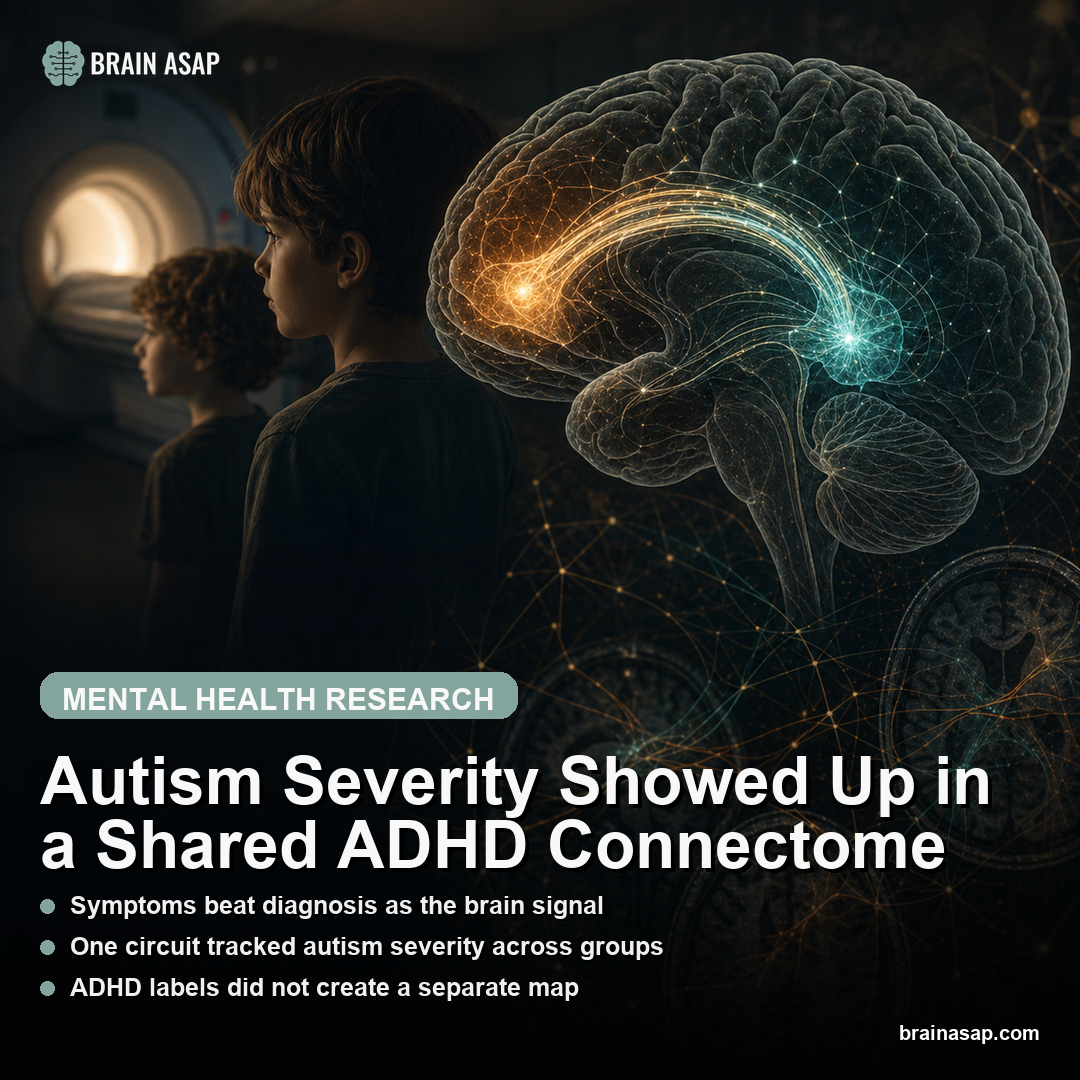
Autism Severity Showed Up in a Shared ADHD Connectome
TL;DR: In 166 verbal children diagnosed with either autism or ADHD without autism, stronger resting-state coupling between the left middle frontal gyrus and posterior cingulate cortex tracked clinician-rated autism severity across both diagnoses, while ADHD symptom ratings showed no comparable brain-wide signal.
Key Findings
- 166 low-motion scans, 2 diagnoses: The study analyzed 63 autistic children and 103 children with ADHD without autism, all ages 6 to 12, after excluding high-motion scans.
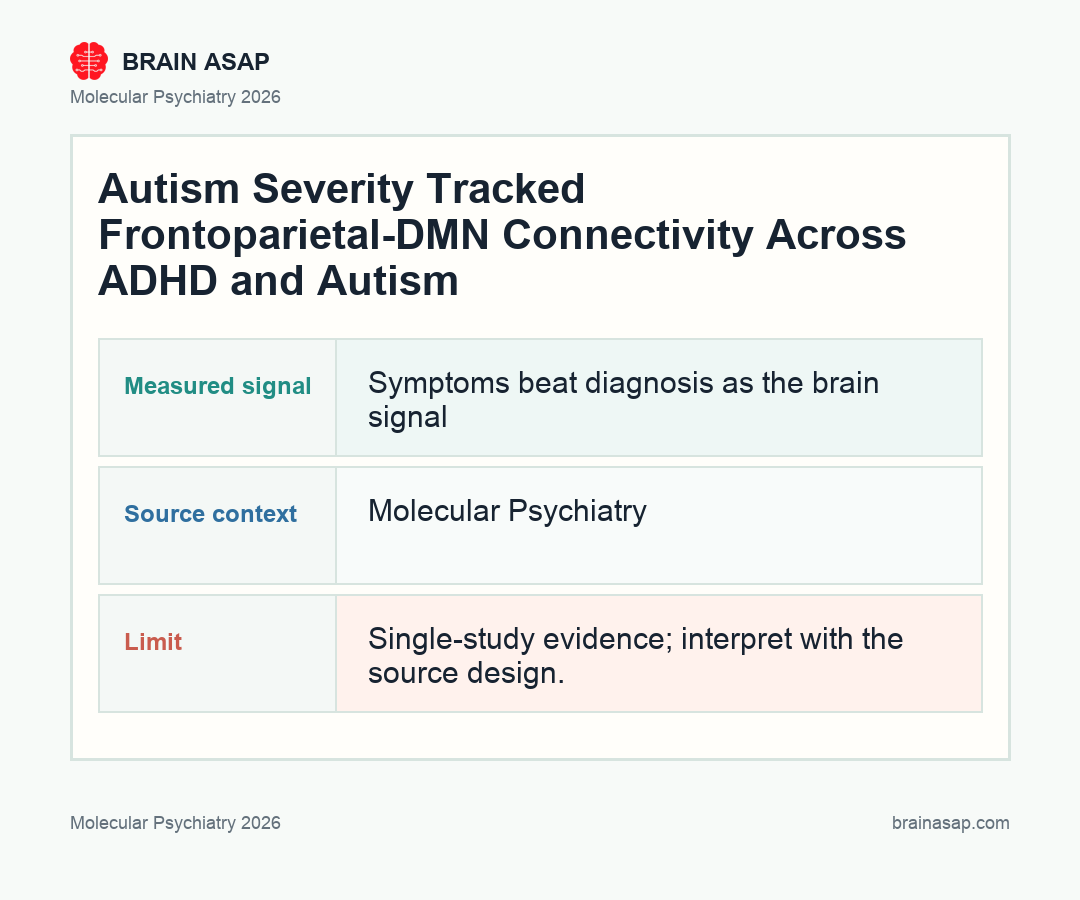
- One frontoparietal-default mode bridge stood out: Whole-brain multivariate distance matrix regression linked autism severity to connectivity between the left middle frontal gyrus and posterior cingulate cortex/precuneus.
- Autism signal crossed diagnoses: The stronger that internetwork coupling became, the higher the ADOS-2 calibrated severity score, even after controlling for ADHD symptom ratings.
- No ADHD-wide counterpart emerged: The same pipeline did not find statistically significant whole-brain associations for clinician- or parent-rated ADHD symptom dimensions.
- 37% of the ADHD group crossed the autism cutoff: Among children diagnosed with ADHD without autism, 38 of 103 still scored at or above the ADOS-2 autism-spectrum threshold, underscoring how much symptom overlap the paper was capturing.
- Gene enrichment pointed downstream of the connectome: The connectivity map was enriched for genes with elevated variant burden in autism and ADHD and for genes involved in neuron projections.
Source: Molecular Psychiatry (2026) | Segura et al.
Autism and ADHD are usually discussed as neighboring diagnoses, not as two routes into the same circuit problem. This paper takes the dimensional view seriously. Instead of asking which diagnosis a child had, the authors asked whether specific symptom burdens lined up with specific resting-state connectivity patterns, even when those symptoms crossed diagnostic borders.
Why a Diagnostic Label Was Not the Most Interesting Variable
The classic design in developmental psychiatry is to compare one diagnosis against another, or one diagnosis against controls, then look for average brain differences. That design is useful until the symptoms stop respecting the labels.
Autism and ADHD are a perfect example. They co-occur often, they share genetic liability, and in clinic the line between “autistic traits” and “ADHD traits” can get blurry fast.
This study leans into that messiness instead of treating it like contamination. The authors recruited 166 verbal children between ages 6 and 12, then measured autism symptoms with clinician observation and ADHD symptoms with structured parent interview. The key move is that everyone was deeply phenotyped for both domains, whether the child’s best-estimate diagnosis was autism or ADHD without autism.
The reason is symptom ratings from different informants do not behave the same way. In this sample, clinician-observed autism severity carried information that parent questionnaires alone did not. It was the observation-based ADOS-2 calibrated severity score, not a broad parent-reported distress signal, that anchored the brain result.
How One Left-Hemisphere Circuit Tracked Autism Severity Across Both Groups
The main finding lives in a connection between two well-known networks. One node sat in the left middle frontal gyrus, part of the frontoparietal network that helps flexibly direct attention and cognitive control. The other sat in the posterior cingulate cortex/precuneus, a hub of the default mode network that is heavily involved in internally directed thought and social-cognitive processing.
Across children, greater coupling between those nodes meant more severe autism symptoms. Not “more likely to have an autism diagnosis.” More severe autistic behavior on clinician observation, even after statistically controlling for ADHD ratings. That is a more interesting claim because it says the circuit follows the symptom dimension itself, not simply the chart label.
The paper strengthens that point with follow-up segregation analyses. Autism severity was linked to weaker separation between the default mode network and the frontoparietal, dorsal attention, and visual networks. The network boundary looked leakier in the children with more severe autistic presentation.
That pattern fits a recurring theme in autism imaging: not a single broken region, but altered coordination between systems that are supposed to stay partly distinct. What this paper adds is the cross-diagnostic angle. The same pattern persisted even when the sample included many children whose primary diagnosis was ADHD.
ADHD Symptoms Did Not Produce Their Own Brain-Wide Hit
The null result for ADHD is almost as informative as the positive result for autism. The researchers tested clinician-rated inattentive and hyperactive symptoms plus parent questionnaires, and none of those measures produced a statistically significant whole-brain relationship after the study’s correction thresholds.
That does not show ADHD has no functional-connectivity biology. It means that in this tightly phenotyped, motion-controlled sample, the strongest transdiagnostic brain-behavior signal belonged to autism severity, not to ADHD severity.
The distinction is important because the field often assumes that if two disorders overlap clinically, they will overlap equally at the circuit level. This paper suggests the shared biology may be more asymmetric.
There is another subtle point here. In the ADHD-without-autism group, 38 children, or about 37%, still crossed the ADOS-2 threshold for autism-spectrum severity.
That means the study was not comparing tidy, isolated syndromes. It was comparing children whose symptoms genuinely bled into one another, which makes the autism-specific connectivity effect harder to dismiss as a labeling artifact.
What the Gene-Enrichment Step Adds Beyond an fMRI Correlation
Functional MRI, or fMRI, tracks blood-flow changes as a proxy for brain activity. In this study, resting-state fMRI let the authors ask how autism severity related to communication between large-scale brain networks.
A lot of imaging papers stop once they have identified a circuit map. This one takes one extra step and asks whether the spatial pattern of connectivity differences overlaps with known gene-expression gradients in the human brain. That analysis is in silico, so it is not direct molecular measurement from the children, but it does help connect macroscale imaging to a plausible biological substrate.
The enriched genes were notable in three ways:
- Shared liability: they overlapped with genes that show elevated variant burden across autism and ADHD.
- Projection biology: they were involved in neuron projections, the cellular machinery needed for long-range communication.
- Circuit relevance: the gene pattern fit the imaging result rather than pointing to an unrelated biological system.
That does not prove causality, and it does not show the paper has found “the autism gene network.” What it does is narrow the conversation. The connectivity pattern was not just floating in statistical space. It landed in genomic territory that already makes sense for neurodevelopmental circuit formation and inter-regional communication.
The Study Pushes Biomarker Research Toward Symptoms Instead of Silos
The practical takeaway is less about immediate diagnosis and more about biomarker strategy. If autism severity can map onto the same circuit phenotype in children diagnosed with autism and in children diagnosed with ADHD without autism, then biomarker work built only around categorical case-control comparisons may keep missing the cleaner signal.
The sample also shows the clinical problem. Children in the ADHD group had similar ADHD severity to the autistic group, but a large minority also carried meaningful autism-spectrum burden on direct observation. That is exactly the kind of child for whom rigid diagnostic silos tend to flatten the real phenotype.
The study still has limits. The sample included only verbal children with IQ above 65, and the resting-state scans were relatively brief.
It is a strong mechanistic clue, not a deployable clinical test. But it is a useful clue, because it suggests that one of the cleanest circuit signals shared across autism and ADHD is not “ADHD biology” at all. It is the degree of autistic symptom burden a child carries, regardless of which box they were put in first.
The sharpest sentence in the paper is this one: a diagnosis crossed over, but the connectome kept following autism severity. That is exactly the kind of result the field has needed from transdiagnostic imaging.
Paper: Connectome-based symptom mapping and in silico related gene expression in children with autism and/or attention-deficit/hyperactivity disorder. Molecular Psychiatry. 2026;31:282-295. DOI: 10.1038/s41380-025-03205-8
Authors: Segura et al.
Study Design: Human resting-state connectome study linking symptom severity to functional connectivity and in silico gene-expression patterns.
Sample Size: 166 low-motion scans, 2 diagnoses: The study analyzed 63 autistic children and 103 children with ADHD without autism, all ages 6 to 12, after excluding high-motion scans.
Key Statistic: One frontoparietal-default mode bridge stood out: Whole-brain multivariate distance matrix regression linked autism severity to connectivity between the left middle frontal gyrus and posterior cingulate cortex/precuneus.
Important Caveat: The sample included verbal children with IQ above 65 and relatively brief resting-state scans, so the result is a mechanistic clue rather than a clinical test.