
TL;DR: Two research teams used different methods to map the brain’s wiring in the same 1,065 young adults, then checked for differences between men and women. They almost always agreed on the fiber-quality measures, clashing just once in 343 comparisons, but disagreed more often about the size of the wiring tracts.
Key Findings
- Same scans, two methods: 1,065 healthy adults aged 22 to 35, analyzed independently by labs in the US and France.
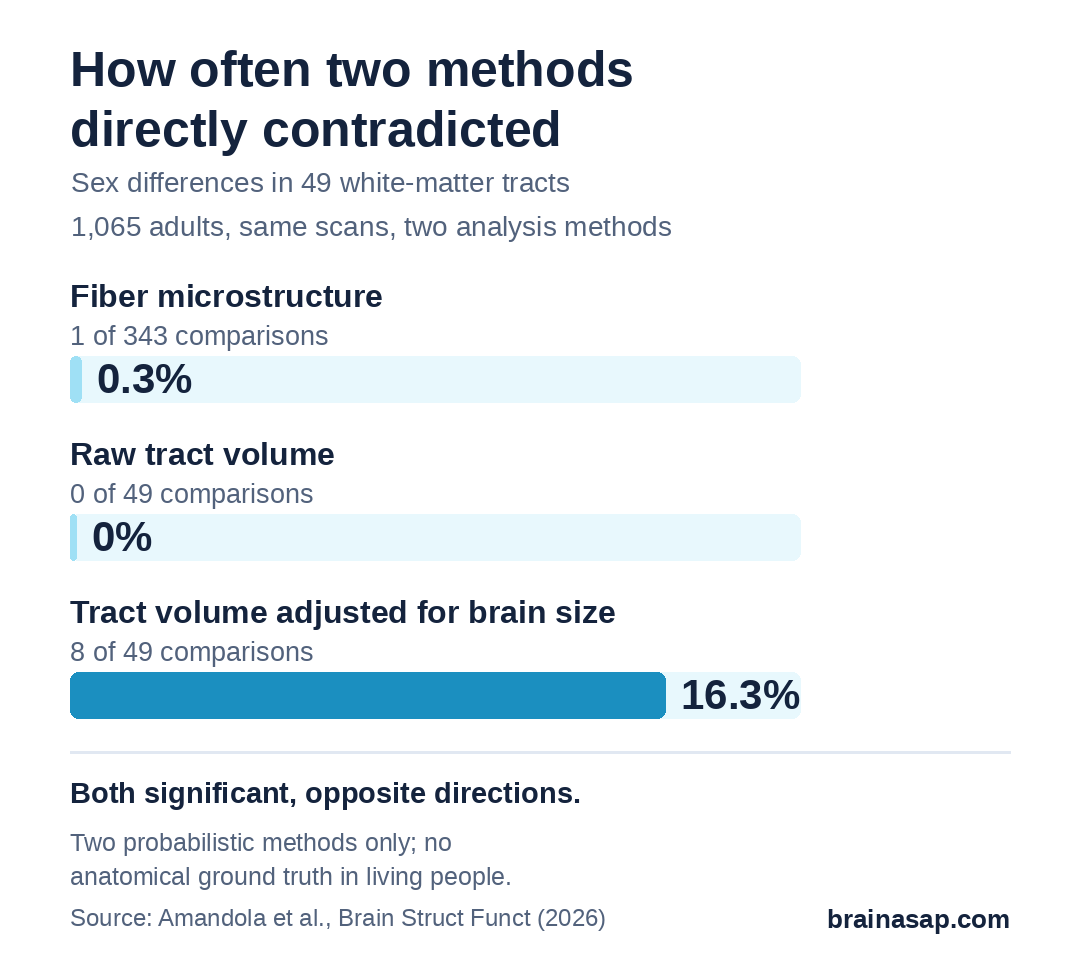
- Rare direct clashes: Only 9 of 441 comparisons (2%) had both methods find opposite significant results.
- Fiber measures held up: Just 1 clash in 343 microstructure comparisons.
- Size adjusted for brain size was shaky: 8 of the 9 clashes.
- Direction usually matched: 86.6% of comparisons pointed the same way.
Source: Brain Structure and Function (2026) | Amandola et al.
Brain scans that trace white matter, the bundles of nerve fibers linking brain regions, have become a staple of neuroscience. But there is no single standard way to do it, and earlier work showed different methods can draw strikingly different versions of the same pathway.
That raises an uncomfortable question for any study using these scans: would the conclusions change if someone else ran the analysis?
Two Labs, One Dataset
Researchers at Vanderbilt University in Tennessee teamed up with the group at NeuroSpin near Paris that had published a large study of sex differences in white matter. Both labs took the same brain scans from the Human Connectome Project:
- Participants: 1,065 healthy adults aged 22 to 35 (575 women, 490 men)
- Method 1 (Paris): Maps all fibers in the brain, then sorts them into named tracts using an atlas
- Method 2 (Vanderbilt): Uses a trained neural network to find each tract directly
The methods also differed in how they modeled the scan data and averaged values along each tract. Both labs measured 49 shared tracts on nine features, giving 441 sex comparisons in total.
What the Nine Features Measure
Seven of the features describe the fine structure of the fibers, such as how freely water moves along versus across them, a rough guide to how tightly packed and organized they are. These are called microstructure measures.
The other two describe tract size: raw volume, and volume divided by total brain volume. Since men’s brains are larger on average, that adjustment matters.
Nearly Perfect Agreement on Fiber Structure
For the seven microstructure measures, the two methods disagreed outright just once in 343 comparisons. Both found men had higher values on most measures, while women had higher values on one, fractional anisotropy, across tracts.
Looser standards told a similar story. Overall, 61.7% of comparisons agreed fully, with both methods significant in the same direction or both not significant. Counting cases where only one reached significance but both pointed the same way, agreement rose to 86.6%.
Tract Size Was the Weak Spot
Raw tract volume agreed well, and Method 2 traced bigger tracts overall. After dividing by brain size, though, the methods split on 8 of 49 tracts. In those cases Method 1 kept a men-higher pattern while Method 2 flipped to women-higher.
The authors suspect the problem is the adjustment itself. White matter does not grow in simple proportion to overall brain size, so dividing by brain volume can introduce bias.
The one microstructure clash involved a measure of neurite density, which Method 2 rated higher throughout the white matter even before tracing began.
What This Does and Doesn’t Show
- Only two methods: Both probabilistic; the simpler deterministic method used in many hospitals was not tested
- No ground truth: Scans cannot be checked against actual dissected fibers in living people
- High-quality research scans: Results may not hold for typical clinical scans
- Young adults only: Ages 22 to 35
- Group averages: These differences say nothing about any one person’s abilities, and the paper makes no claims about thinking or behavior
- Field not settled: Other large studies have found men, not women, with higher fractional anisotropy
A Reassuring Check for Brain-Wiring Research
The authors say this level of agreement is similar to how well studies hold up when reanalyzed in other fields. Two careful teams are unlikely to reach opposite conclusions about fiber structure.
The next test is whether the same holds across a wider range of methods, older or patient groups, and everyday hospital scans, and whether there is a better way to adjust tract size for brain size.
Citation: DOI: 10.1007/s00429-026-03198-2. Amandola M, Herlin B, Kim ME, et al. Sex-related variability of white-matter tracts is robust to tractography methodology. Brain Struct Funct. 2026;231:137.
Study Design: Cross-pipeline reproducibility comparison of two automated probabilistic tractography methods on the same dataset.
Sample Size: 1,065 healthy adults aged 22 to 35 (575 women, 490 men); 49 tracts and 9 features.
Key Statistic: Strict disagreement in 9 of 441 comparisons (2%); 1 of 343 for microstructure; 8 of 49 for normalized volume.
Caveat: Two methods only; no deterministic tractography; no anatomical ground truth; group-level findings only.