TL;DR: A 2026 medRxiv preprint used single photon emission computed tomography (SPECT), a brain blood-flow imaging method, and a 68-component NeuroMark template to link depression-related symptoms with frontal, subcortical, cerebellar, salience, and visual network patterns across several psychiatric groups.
Key Findings
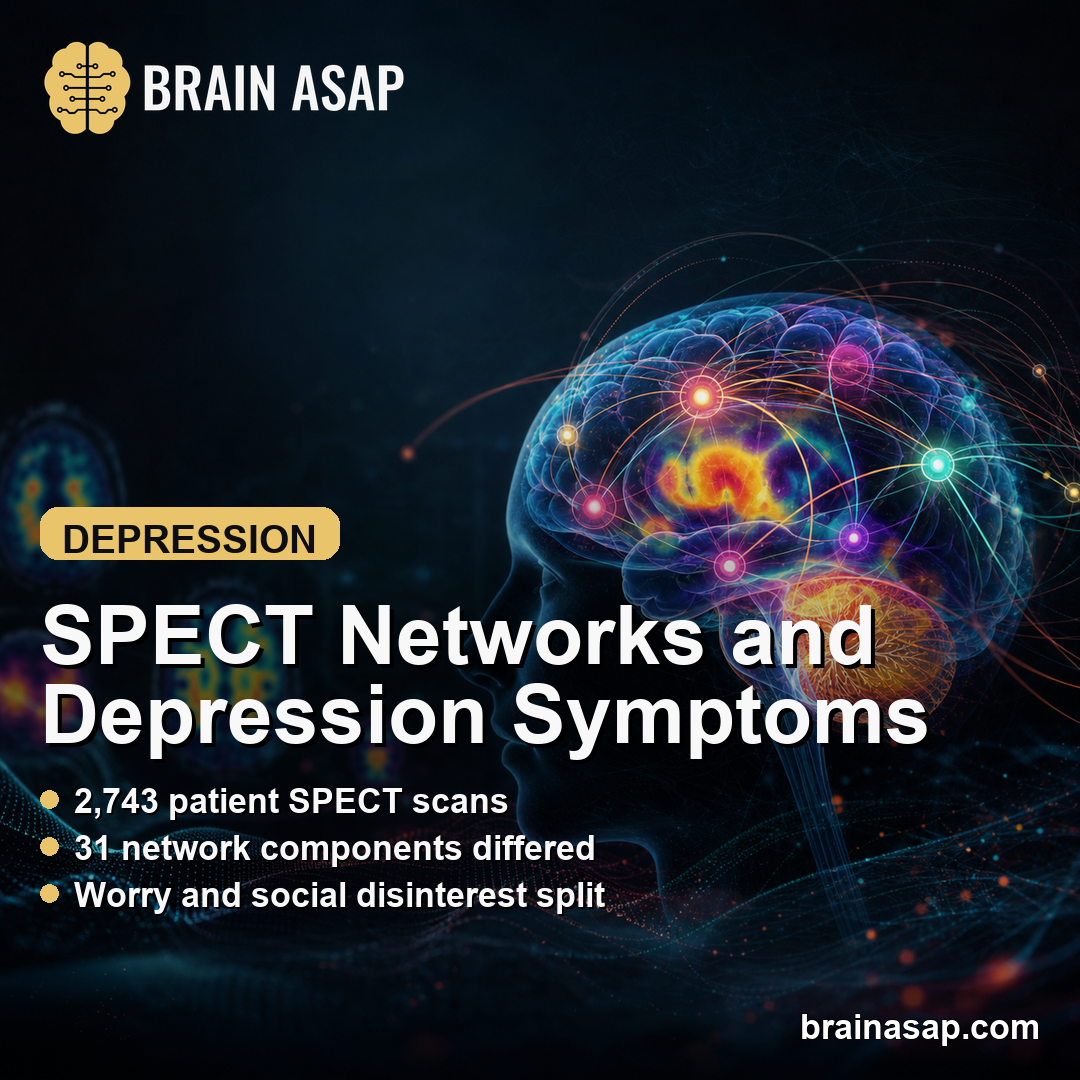
- Large imaging pool: Researchers analyzed 2,743 patient SPECT scans with clinical data plus 76 healthy controls from the Amen Clinic dataset.
- NeuroMark SPECT template: The analysis used 68 brain perfusion components, which means the scan was decomposed into repeatable blood-flow network patterns rather than read as one global image.
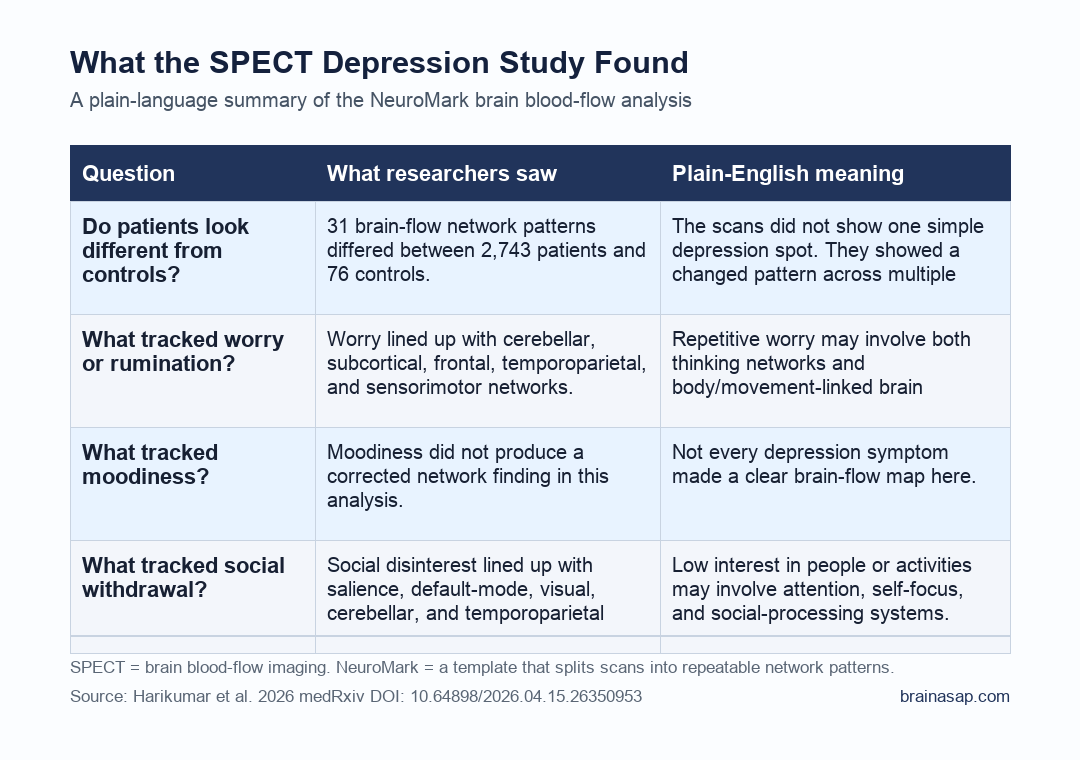
- Patient-control differences were broad: 31 components differed after false-discovery-rate correction, with controls showing wider loading expression and patients showing a more restricted pattern.
- Symptoms split by network: Worry/rumination tracked cerebellar, subcortical, higher-cognition, and sensorimotor components, while social disinterest centered on cerebellar, higher-cognition, default-mode, salience, and visual regions.
- Preprint boundary: The finding is exploratory and not a diagnostic test; the patient-control groups were imbalanced, and the findings need independent replication with stronger clinical measures.
Source: Harikumar et al. medRxiv. 2026.
Depression rarely arrives as one clean symptom cluster. A patient may show rumination, low motivation, attention problems, anxiety, autistic traits, bipolar-spectrum symptoms, or schizotypal features in the same clinical record.
The Harikumar preprint handles that clinical mix directly. Researchers did not treat depression symptoms as a single score.
They asked whether SPECT-measured regional cerebral blood flow, analyzed through a NeuroMark SPECT template, could expose network patterns that cut across diagnostic labels.
SPECT and NeuroMark Turned Blood-Flow Scans Into Network Components
SPECT is a nuclear medicine scan that estimates regional cerebral blood flow. In psychiatry research, blood-flow patterns can act as a rough window into which brain systems are more or less active during a scan state.
The analysis used spatially constrained independent component analysis, or sc-ICA. Put simply, researchers used a template to separate the SPECT data into 68 repeatable perfusion networks.
They then estimated how strongly each network was expressed in each person.
- Dataset: 2,743 patients with depression-related clinical data and SPECT scans, compared with 76 healthy controls.
- Scan conditions: Each patient had rest and attention-task SPECT scans, with rest injection followed by about 30 minutes before imaging.
- Template method: The NeuroMark SPECT template let researchers compare component expression across people instead of relying on one region-by-region visual read.
- Clinical variables: The team focused on three depression-relevant factors: worry/rumination, moodiness, and social disinterest.
This does not make SPECT a depression biomarker. It makes the scan a structured research readout: a way to test whether symptom dimensions have repeatable network associations.
Patient Scans Showed a More Restricted Network Pattern Than Controls
The patient-control comparison found 31 significant NeuroMark components after false-discovery-rate correction, a multiple-comparison method that lowers the chance of treating random noise as a real finding.
Controls showed broader component loadings across cerebellar, higher-cognition frontal, higher-cognition temporal/parietal, triple-network default-mode, central executive, and visual-occipital domains. Patients showed stronger loadings in a narrower set of cerebellar, subcortical, triple-network default-mode, and visual components.
The patient group did not simply show higher or lower brain activity across the template. The loading pattern looked more segregated, meaning fewer network domains carried the stronger patient-side loadings.
Worry and Social Disinterest Did Not Map the Same Way
The symptom-level analysis is the clinically sharper part for transdiagnostic psychiatry. Researchers compared component loadings with clinical factors rather than stopping at the diagnostic group label.
- Worry/rumination: Cerebellar, subcortical basal ganglia, subcortical extended hippocampus, and sensorimotor components were positively associated with worry. Higher-cognition frontal, higher-cognition temporoparietal, and sensorimotor components were negatively associated.
- Moodiness: The preprint reports that no components associated with moodiness survived false-discovery-rate correction, so this symptom factor did not produce a publishable corrected network map in this analysis.
- Social disinterest: Cerebellar, higher-cognition temporoparietal, triple-network default-mode, triple-network salience, and visual components were implicated. Component 55 in the salience network had a strong negative association.
Depression symptoms can look similar at the chart level while reflecting different brain-system relationships. Rumination may lean toward subcortical, cerebellar, higher-cognition, and sensorimotor patterns.
Social disinterest may involve salience and default-mode network behavior more directly.
The Study Fits Transdiagnostic Psychiatry Better Than a One-Disorder Model
The diagnostic groups included anxiety, autism, attention-deficit/hyperactivity disorder (ADHD), bipolar disorder, depression, and schizotypal personality profiles. Those labels are clinically useful, but symptoms such as worry, motivation loss, social withdrawal, and executive dysfunction cross those boundaries.
Transdiagnostic here means the analysis looked for symptom-network patterns that might matter across diagnoses. The conditions remain clinically distinct.
Shared symptom dimensions may have measurable network correlates even when the chart labels differ.
The strongest future application would not be a simple SPECT screen for depression. A more realistic path is research stratification: identifying which symptom dimensions and network patterns deserve targeted follow-up in larger, independent samples.
Why the Result Should Stay Preliminary
This is a preprint, so it has not gone through journal peer review. The control group was also much smaller than the patient group, with 76 controls compared with more than 2,700 patients.
That imbalance can make group comparisons harder to interpret even when statistical corrections are used.
- Clinic-derived sample: The scans came from a clinical imaging dataset, not a population-based cohort.
- Control imbalance: The patient group was large, but the healthy-control group was comparatively small.
- Symptom measurement: The clinical factors came from checklist items, not a deep structured interview designed only for this study.
- No diagnostic claim: The work suggests network associations; it does not validate SPECT as a stand-alone depression, ADHD, autism, bipolar, or anxiety test.
The bottom line is concrete. Depression-related symptoms were not flat across the NeuroMark SPECT template.
Worry and social disinterest had different corrected network signatures, and moodiness did not survive correction. A transdiagnostic model should be able to handle that kind of difference.
Citation: DOI: 10.64898/2026.04.15.26350953. Harikumar et al. Examining comorbid and transdiagnostic depression clinical outcomes across anxiety, autism, attention deficit hyperactivity disorder (ADHD), bipolar disorder, depression, and schizotypal personality groups: a novel NeuroMark SPECT approach. medRxiv. 2026.
Study Design: Retrospective clinical SPECT imaging analysis using NeuroMark template-based spatially constrained independent component analysis.
Sample Size: 2,743 patients with SPECT images and clinical data, plus 76 healthy controls.
Key Statistic: 31 NeuroMark SPECT components differed between patients and controls after false-discovery-rate correction.
Caveat: This is an exploratory preprint from a clinic-derived dataset, not a validated diagnostic biomarker.