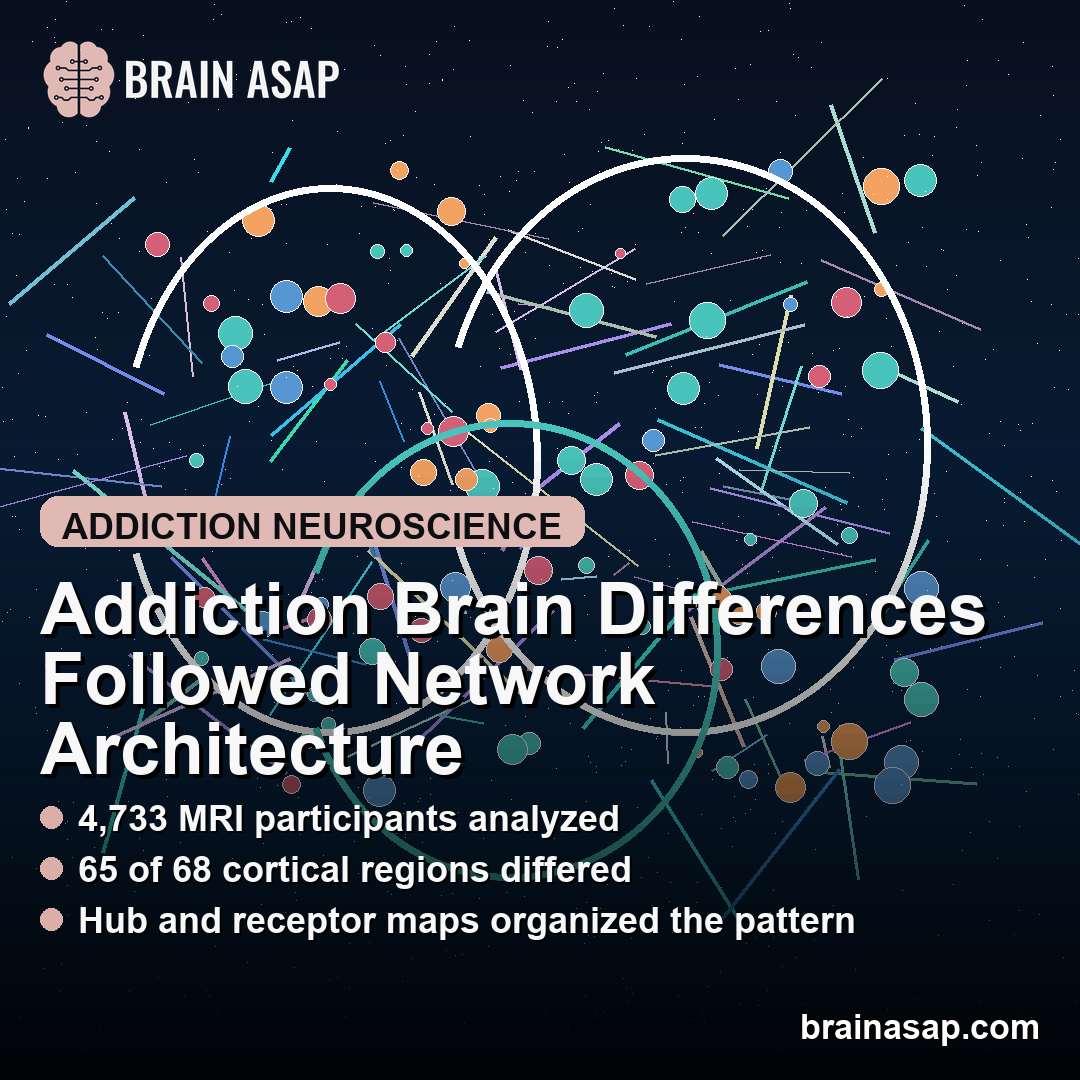
TL;DR: A 2026 medRxiv preprint from the ENIGMA Addiction Working Group used structural MRI from 2,782 people with substance use disorder (SUD) and 1,951 controls and reported that addiction-related brain differences followed cortical network hubs and neurotransmitter receptor maps.
Key Findings
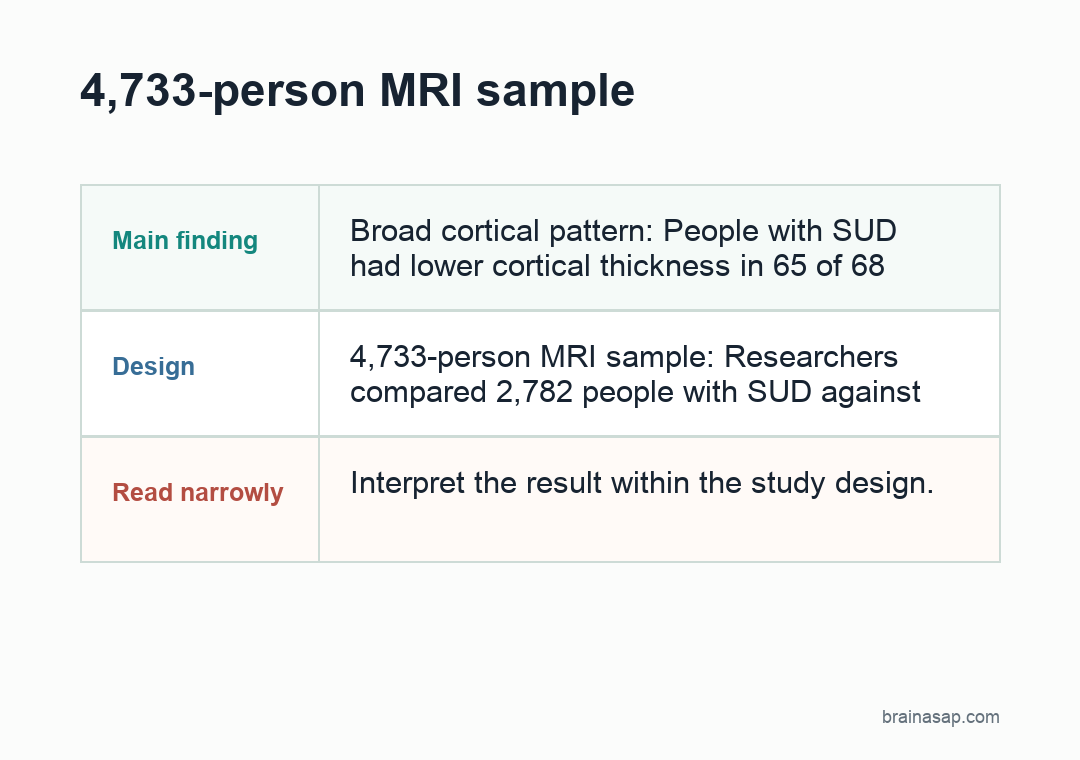
- 4,733-person MRI sample: Researchers compared 2,782 people with SUD against 1,951 controls across 51 international ENIGMA Addiction sites.
- Broad cortical pattern: People with SUD had lower cortical thickness in 65 of 68 cortical regions after false-discovery-rate correction.
- Limbic volume signal: Eleven of 14 subcortical structures had reduced volume metrics, with the largest effects in the hippocampus and amygdala.
- Hub vulnerability: Cortical differences were stronger in highly connected hub regions, with functional centrality r = -0.49 and structural centrality r = -0.49.
- Receptor alignment: Two neurotransmitter-related axes explained about 90% of the covariance between receptor-density maps and SUD cortical-thickness differences.
Source: medRxiv preprint (2026) | Georgiadis, Milano et al.
Substance use disorder (SUD) is not only a behavioral diagnosis. It also involves measurable differences in brain structure, especially in cortical thickness and subcortical volume.
The new analysis asked a more specific question: whether those MRI differences follow the brain’s existing wiring and neurochemical layout.
Researchers combined case-control structural MRI maps with normative brain-connectivity data and receptor-density maps. That design does not prove that addiction causes a specific brain change, but it can test whether the regional pattern looks organized rather than random.
Structural MRI Showed a Broad Addiction-Linked Brain Pattern
The dataset came from the ENIGMA Addiction Working Group, a large international collaboration. Researchers analyzed T1-weighted MRI scans from 2,782 people with SUD and 1,951 healthy controls across 51 sites.
The SUD group included alcohol, amphetamine, cannabis, cocaine, nicotine, and opioid diagnoses. For substance-specific analyses, researchers used 2,312 single-SUD cases so one diagnosis would not blur every comparison.
The strongest combined finding was a widespread cortical-thickness pattern. After correction for multiple comparisons, people with SUD had lower cortical thickness in 65 of 68 cortical regions.
- Frontal cortex: the left superior frontal gyrus had one of the largest cortical effects, with Cohen’s d = -0.33.
- Parietal cortex: the right inferior parietal cortex also showed a notable reduction, with Cohen’s d = -0.29.
- Temporal and limbic systems: the spatial pattern extended beyond one executive-control region into broader association and emotion-related networks.
Subcortical results moved in the same general direction. The study reported reduced volume metrics in 11 of 14 subcortical structures.
The strongest subcortical effects appeared in the hippocampus and amygdala, two limbic structures relevant to memory, stress, emotion, and reward learning.
Alcohol and cocaine showed the largest substance-specific cortical effects after additional checks. Cannabis showed a more circumscribed limbic pattern, while amphetamine and opioid findings were smaller and did not survive the same correction threshold.
Highly Connected Cortical Hubs Carried More of the Signal
The network analysis tested a hub-vulnerability idea. A brain hub is a region with many functional or structural connections, making it important for information flow but potentially expensive to maintain.
Researchers used Human Connectome Project data from 207 healthy adults to create normative connectivity maps. Then they asked whether SUD MRI differences were larger in regions that are normally more connected.
The cortex showed the centrality pattern. Cortical thickness differences correlated with both functional and structural degree centrality, each at r = -0.49.
The negative sign means more central regions tended to show larger SUD-related thinning.
- Functional hubs: regions with stronger resting-state connectivity showed greater cortical involvement.
- Structural hubs: regions with stronger diffusion-MRI connectivity followed a similar pattern.
- Subcortical exception: subcortical volume differences did not follow the same centrality pattern.
The cortical-subcortical split keeps the claim specific. The study does not say every brain region is equally affected in addiction.
Instead, cortical differences appeared partly shaped by the same network architecture that lets regions communicate.
Epicenter Maps Pointed to Limbic and Orbitofrontal Regions
The researchers also used epicenter mapping. In this context, an epicenter is not a proven starting point for disease.
It is a region whose normal connectivity profile best matches the spatial pattern of observed MRI differences.
Functional cortical epicenters formed a distributed network that included medial temporal and orbitofrontal regions, with extensions into frontoparietal cortex.
Subcortical epicenters mainly involved the hippocampus, amygdala, and striatal regions.
The pattern was not identical across substances. Alcohol and cocaine had the highest similarity to the combined SUD epicenter profile.
Opioid findings were less stable, likely because the opioid subgroup had only 68 cases.
- Shared architecture: different SUD categories showed similar broad spatial patterns.
- Substance differences: effect size and regional emphasis still varied by substance.
- Sample-size caution: smaller groups can make substance-specific maps less reliable.
Cross-disorder comparisons added another layer. SUD epicenters overlapped most clearly with schizophrenia and bipolar disorder, especially in cortical and subcortical functional epicenter maps.
The overlap was much weaker or absent for obsessive-compulsive disorder, ADHD, and autism spectrum disorder after correction.
Receptor Maps Added a Neurochemical Layer
The receptor analysis tested whether cortical SUD differences aligned with neurotransmitter systems. Researchers used normative receptor-density maps and partial least squares modeling to compare receptor distributions with cortical-thickness differences.
Two latent variables explained about 90% of the total covariance between receptor-density maps and SUD cortical differences.
One axis contrasted cannabinoid and opioid receptor patterns with other systems. Another involved dopamine-related and other receptor markers.
Both receptor axes also tracked network centrality. The MRI pattern was not only anatomical, and it was not only neurochemical.
It sat at the intersection of connectivity architecture and neurotransmitter organization.
The clinical boundary is important because this is a preprint. The paper has not yet been peer reviewed.
A case-control MRI design also cannot prove whether the structural pattern came before substance exposure, followed it, or reflected a mixture of vulnerability, exposure, comorbidity, and recovery history.
The clearest reading is narrower and still useful. In a large ENIGMA sample, addiction-related MRI differences were widespread, strongest in several frontal, parietal, temporal, hippocampal, and amygdala measures, and organized by the brain’s existing network and receptor architecture.
Citation: DOI: 10.64898/2026.04.03.26348150. Georgiadis, Milano et al. Network and receptor architectures shape brain morphometry in addiction. medRxiv. 2026.
Study Design: Preprint mega-analysis combining structural MRI case-control maps, normative functional and structural connectivity, psychiatric-disorder epicenter comparisons, and neurotransmitter receptor-density mapping.
Sample Size: 2,782 people with SUD, 1,951 controls, 51 ENIGMA Addiction sites, and 207 Human Connectome Project participants for normative connectivity matrices.
Key Statistic: People with SUD had lower cortical thickness in 65 of 68 cortical regions; cortical effects correlated with functional and structural degree centrality at r = -0.49.
Caveat: The source is a non-peer-reviewed preprint, and the MRI design cannot establish whether the brain differences are causes, consequences, or mixed correlates of SUD.