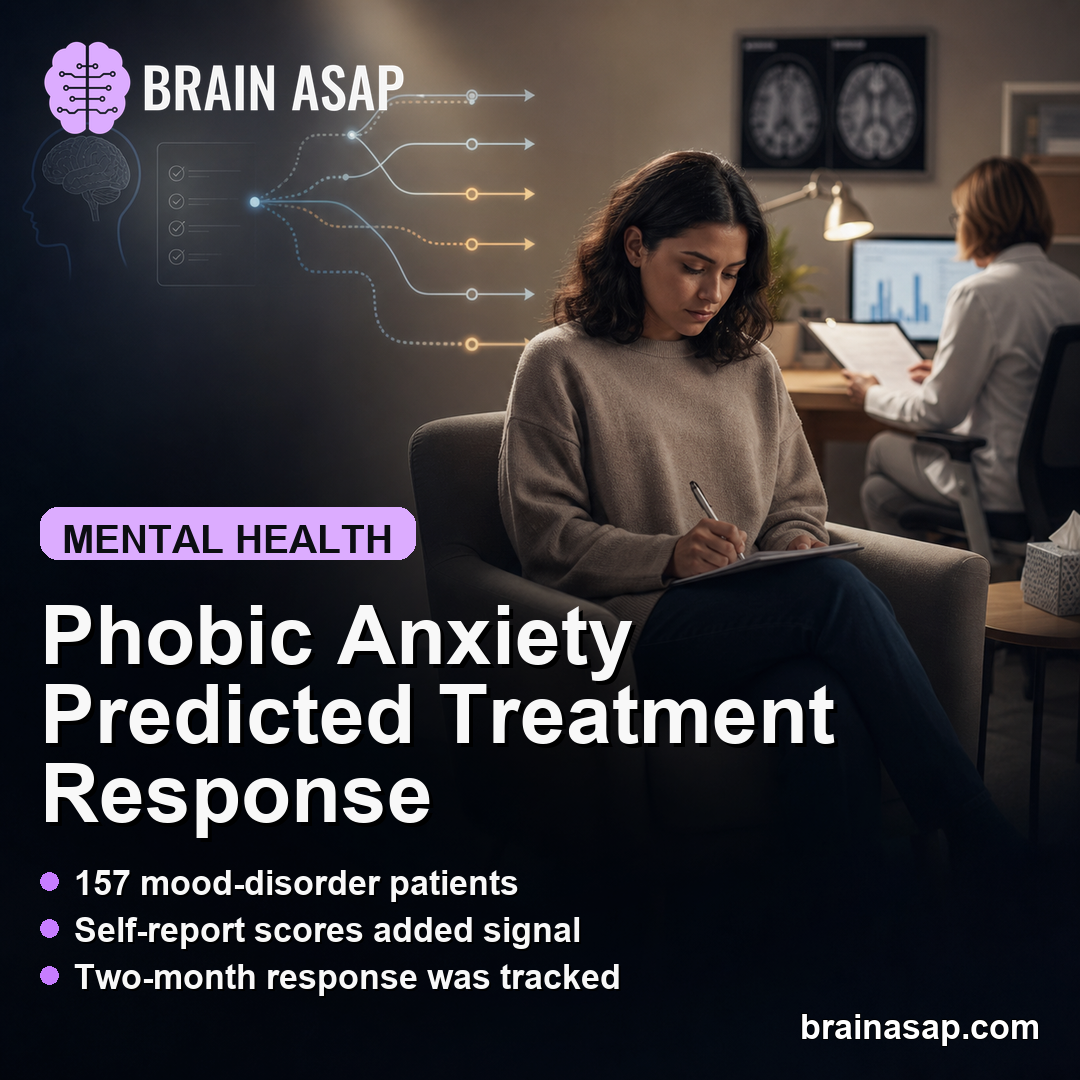
TL;DR: A 2026 longitudinal study in Journal of Korean Medical Science found that self-reported phobic anxiety on the Symptom Checklist-90-Revised helped predict 2-month depression treatment response even when baseline clinician-rated depression and anxiety scores were similar.
Key Findings
- Mood-disorder cohort was followed: The cohort included 157 people with major depressive disorder or bipolar disorder who had moderate or severe depression at baseline.
- 89 were responders: Treatment response was defined by the Montgomery-Asberg Depression Rating Scale (MADRS), a clinician-rated depression scale, after 2 months.
- Baseline clinician ratings matched: Responders and non-responders had similar MADRS, Hamilton Anxiety Rating Scale, Young Mania Rating Scale, and Brief Psychiatric Rating Scale scores at baseline.
- Phobic anxiety predicted response: The phobic-anxiety model had an odds ratio of 1.93 and an AUROC of 0.719, close to the full self-report model at 0.725.
- The model was exploratory: The study was small, medication details were simplified, and sex imbalance may have influenced the prediction results.
Self-reported phobic anxiety was the only baseline SCL-90-R symptom that remained statistically significant after correction for multiple comparisons. The Symptom Checklist-90-Revised (SCL-90-R) asks patients to rate a broad set of distress symptoms.
The study did not say that a questionnaire can decide depression treatment by itself. It tested whether patient-reported symptom patterns add useful prediction information when standard clinician-rated depression severity looks similar.
Source: Journal of Korean Medical Science (2026) | Song et al.
157 Mood-Disorder Patients Were Classified by 2-Month MADRS Response
Researchers recruited 157 patients from 6 psychiatric hospitals in Korea between 2018 and 2022. Participants had major depressive disorder or bipolar disorder and were in a moderate or severe depressive state.
The outcome was treatment response after 2 months. Researchers classified 89 patients as responders and 68 patients as non-responders using the Montgomery-Asberg Depression Rating Scale (MADRS).
The baseline clinical picture looked similar across response groups:
- MADRS depression severity: Responders averaged 29.2 and non-responders averaged 28.9.
- Hamilton anxiety score: Responders averaged 15.8 and non-responders averaged 15.2.
- Brief Psychiatric Rating Scale: Responders averaged 41.6 and non-responders averaged 43.1.
- Medication adherence: Reported adherence was 92.3% in responders and 91.0% in non-responders.
Those matched clinician ratings are why the self-report result is worth separating from ordinary baseline severity. The non-responder group did not simply begin with higher clinician-rated depression.
SCL-90-R Phobic Anxiety Was Higher in Non-Responders
Non-responders reported higher baseline scores on several SCL-90-R domains. These included obsessive-compulsive symptoms, interpersonal sensitivity, phobic anxiety, and paranoid ideation.
They also reported lower satisfaction with social relationships on the World Health Organization Quality of Life Assessment Instrument brief form, or WHOQOL-BREF. The social-relationships score averaged 10.1 in responders and 9.1 in non-responders.
After correction for multiple comparisons, phobic anxiety remained significant. The baseline SCL-90-R phobic-anxiety score averaged 0.9 in responders and 1.4 in non-responders.
The contrast is clinically plausible but not diagnostic. It points to fear-related distress that may not show up as a simple difference in clinician-rated anxiety severity.
The assessment difference is practical. A clinician-rated scale can capture observable anxiety severity during the visit, while a self-report inventory may pick up avoidance, fear responses, and interpersonal discomfort that patients experience across daily settings.
Self-Report Models Improved AUROC Beyond Demographics
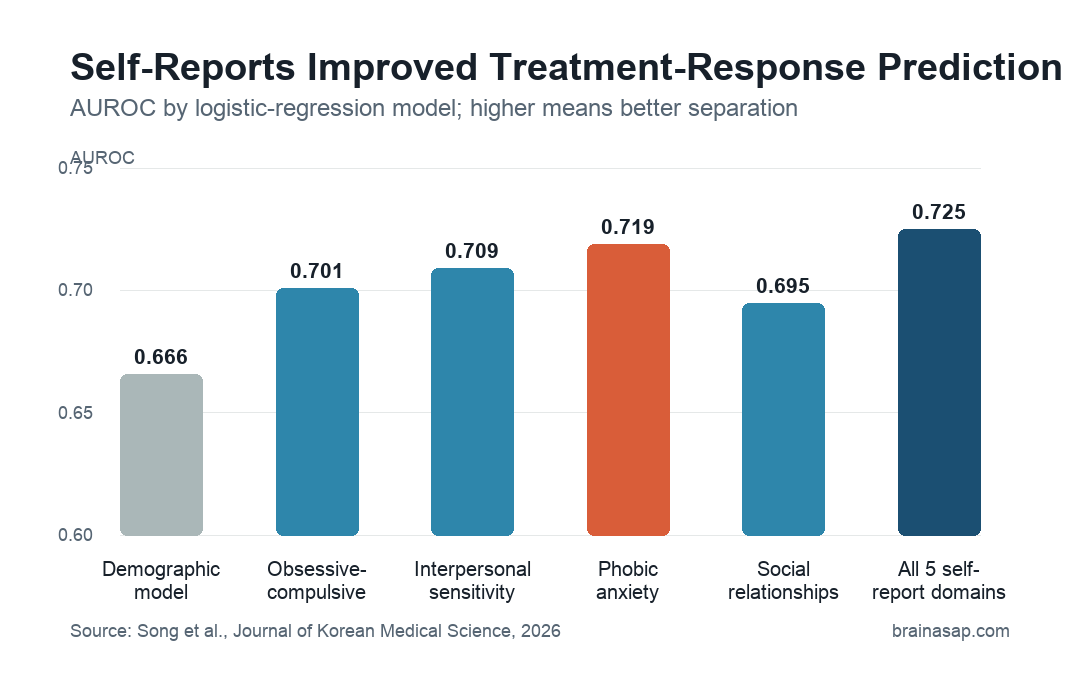
The study compared logistic-regression models using area under the receiver operating characteristic curve, or AUROC. AUROC summarizes how well a model separates responders from non-responders; 0.5 is chance-level performance and 1.0 is perfect separation.
The demographic and clinical-covariate model reached an AUROC of 0.666. Adding single self-report domains improved performance:
- Obsessive-compulsive symptoms: AUROC 0.701, odds ratio 1.66.
- Interpersonal sensitivity: AUROC 0.709, odds ratio 1.77.
- Phobic anxiety: AUROC 0.719, odds ratio 1.93.
- Paranoid ideation: AUROC 0.688, odds ratio 1.50.
- Social relationships: AUROC 0.695, odds ratio 0.86.
The full model, which included all 5 self-report domains, reached an AUROC of 0.725. That was only slightly above the phobic-anxiety model, so phobic anxiety carried much of the prediction gain in this dataset.
Responder Symptoms Improved Broadly, Non-Responder Symptoms Changed Less
The 2 groups also differed in symptom change over 2 months. Responders improved across all 10 MADRS items, while non-responders showed only a mild decrease in the MADRS suicidal-thoughts item.
Self-reported symptoms followed the same pattern. Responders reported broad SCL-90-R improvement and better quality-of-life scores. Non-responders had smaller changes and several domains that did not move.
That longitudinal pattern supports the response classification. It also suggests that the baseline self-report differences were not just questionnaire noise.
Several measurement details matter:
- Mixed diagnoses: The cohort included both unipolar and bipolar depression.
- Real-world treatment: Medication categories were considered, but specific drug types and doses were not deeply modeled.
- Self-report scope: SCL-90-R and WHOQOL-BREF measured distress and quality-of-life domains beyond depression alone.
- Short horizon: The prediction target was 2-month response, not long-term remission.
Self-Reports May Add Context, Not Replace Clinical Assessment
The study’s practical claim is limited. A self-report score may help flag patients whose fear-related distress, interpersonal sensitivity, or social dissatisfaction complicates treatment response.
It does not show that clinicians should choose a treatment based on phobic anxiety alone. AUROC values around 0.72 are informative for research, but they are not accurate enough for stand-alone treatment selection.
The main limitations were sample size, simplified medication handling, possible sex imbalance, and missing stress/life-event variables. The non-responder group had a higher male proportion, and the researchers noted that this could have influenced the findings.
The most defensible clinical reading is that baseline depression severity is not the whole prediction problem. Patient-reported fear, interpersonal distress, and quality-of-life context may add information that standard clinician ratings miss.
Citation: DOI: 10.3346/jkms.2026.41.e68. Song et al. A Longitudinal Study on Predicting Treatment Response in Depression Using Self-Reported Symptoms. Journal of Korean Medical Science. 2026;41:e68.
Study Design: Longitudinal observational study comparing baseline clinician-rated and self-reported symptoms against 2-month depression treatment response.
Sample Size: 157 patients with major depressive disorder or bipolar disorder, including 89 responders and 68 non-responders.
Key Statistic: Adding all 5 self-reported symptom domains increased AUROC from 0.666 to 0.725; the phobic-anxiety model alone reached 0.719 with an odds ratio of 1.93.
Caveat: The model was exploratory, the sample was modest, and medication dose/type plus sex imbalance were not fully resolved.