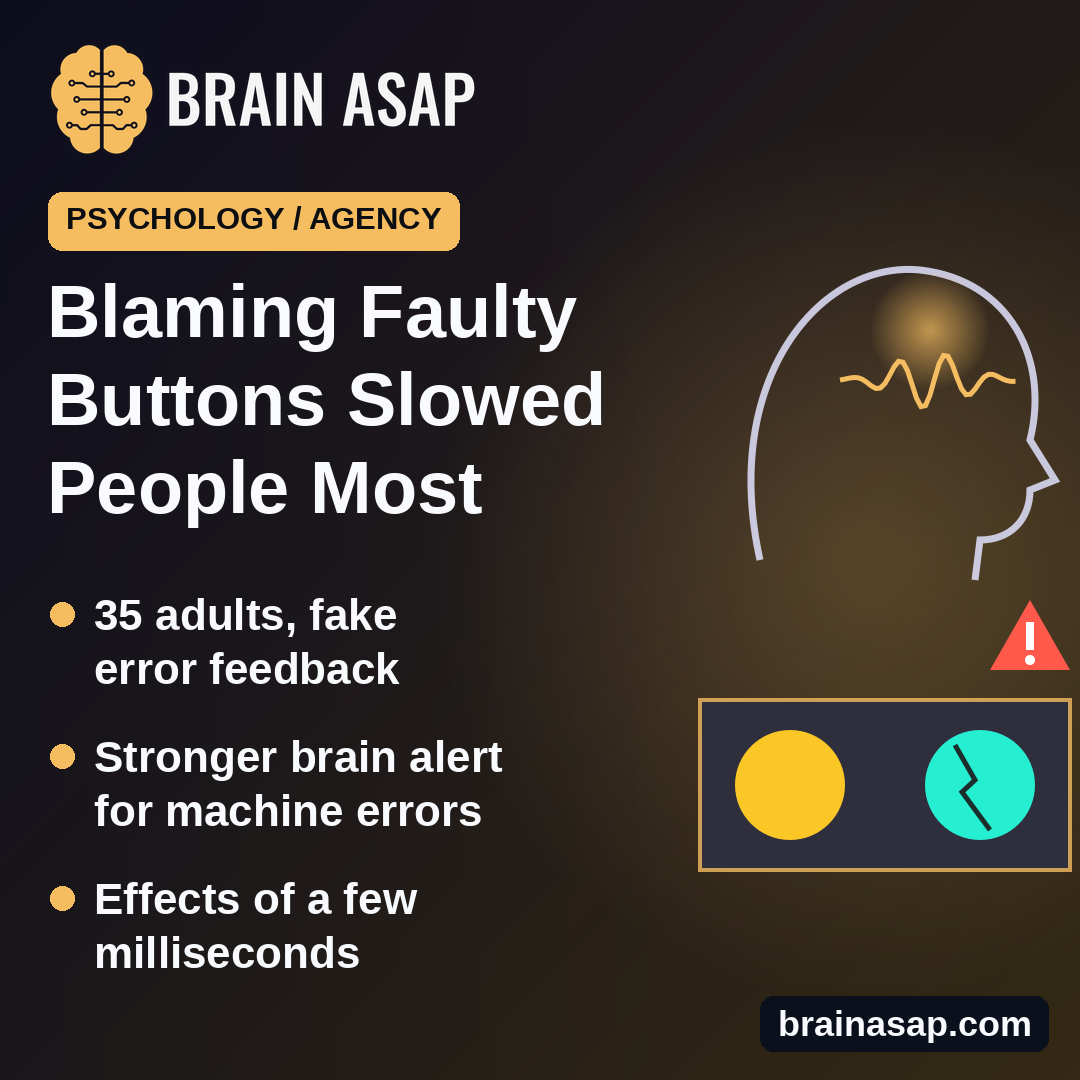
TL;DR: When 35 adults got fake feedback saying they were making more mistakes, they slowed down slightly, and they slowed most when told the buttons were faulty. Errors blamed on the machine also triggered a stronger brain “alert” signal than errors blamed on themselves.
Key Findings
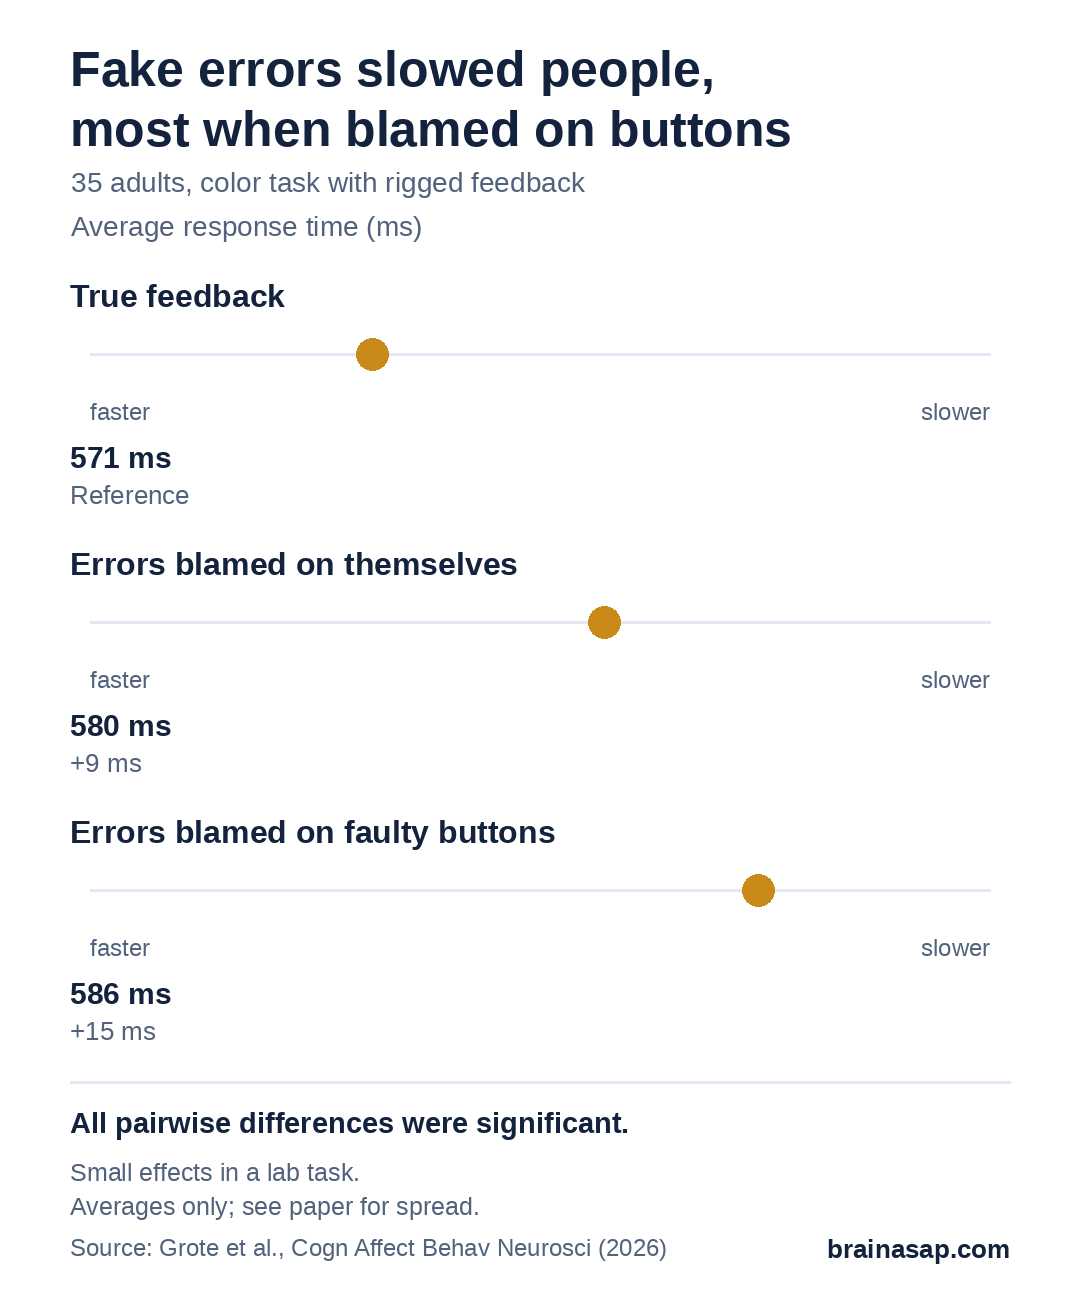
- Slower with fake errors: 571 ms with true feedback, 580 ms when blamed on themselves, 586 ms when blamed on buttons.
- Less preparation: Brain waves showed weaker getting-ready activity before each target.
- Machine-blamed errors: Stronger midfrontal theta, a brain signal tied to noticing problems.
- Small effects in a lab task.
Source: Cognitive, Affective, & Behavioral Neuroscience (2026) | Grote et al.
More and more work happens through computers and machines that don’t always behave. When something goes wrong, we ask: was that me, or the system? That judgment is part of our sense of agency, the feeling that our actions control what happens.
Researchers at the Leibniz Institute for Working Environment and Human Factors in Germany tested how blaming yourself versus blaming a machine changes the way the brain prepares and reacts.
A Color Task With Rigged Feedback
Thirty-five adults wore EEG caps and pressed a left or right button to say which of two colors dominated a flickering square. After each press, they saw feedback. In separate blocks, the feedback was:
- True feedback: Honest results.
- Self-blamed errors: Extra fake errors suggesting their own performance had slipped.
- Machine-blamed errors: Extra fake errors showing the other color, suggesting a faulty button.
Some trials offered higher or lower point rewards.
Fake Errors Slowed People Down
Both kinds of rigged feedback made people respond more slowly, and machine-blamed errors slowed them most. The differences were small, around 9 to 15 milliseconds.
Accuracy was also a little lower with machine-blamed feedback than with true feedback. A model of the decision process suggested the slowdown came from people taking in color evidence less efficiently, and that the two blame conditions differed in the time spent on seeing and moving rather than on deciding.
Brains Prepared Less When Control Felt Shaky
Before each target, alpha waves over the visual areas and beta waves over the movement areas normally dip as the brain gets ready. With either type of rigged feedback, these dips were weaker. The authors read this as people investing less effort in preparing when outcomes felt less under their control.
Blaming the Machine Raised a Bigger Alert
After error feedback, the midfrontal theta signal, linked to noticing that something went wrong, was stronger when errors were blamed on the buttons than when they were blamed on the person. So feeling out of control and deciding who is at fault seem to affect different stages of processing.
Keep in Mind
- Small effects: Differences of a few milliseconds in a lab task.
- Short blocks: People might adapt differently over hours at work.
- Belief not guaranteed: Some people may have doubted the rigged feedback.
- 35 adults: A modest sample for EEG.
Designing Systems People Trust
The findings hint that unreliable machines may quietly reduce how much effort people put into getting ready, and that machine faults grab extra attention. The open question is whether clearer error messages about who is at fault could help people stay engaged when working with imperfect systems.
Citation: DOI: 10.3758/s13415-026-01494-2. Grote LA, Schneider D, Wascher E, Arnau S. Who is to blame? Outcome controllability and error attribution differentially shape cognitive preparation and feedback evaluation. Cogn Affect Behav Neurosci. 2026.
Study Design: Within-subject EEG experiment with manipulated feedback, drift-diffusion modeling and time-frequency analysis.
Sample Size: 35 adults in the final analysis.
Key Statistic: RTs 0.571 s (veridical), 0.580 s (self-attributed), 0.586 s (system-attributed); F(2,68) = 8.34, p = .001.
Caveat: Small effect sizes in a laboratory task.