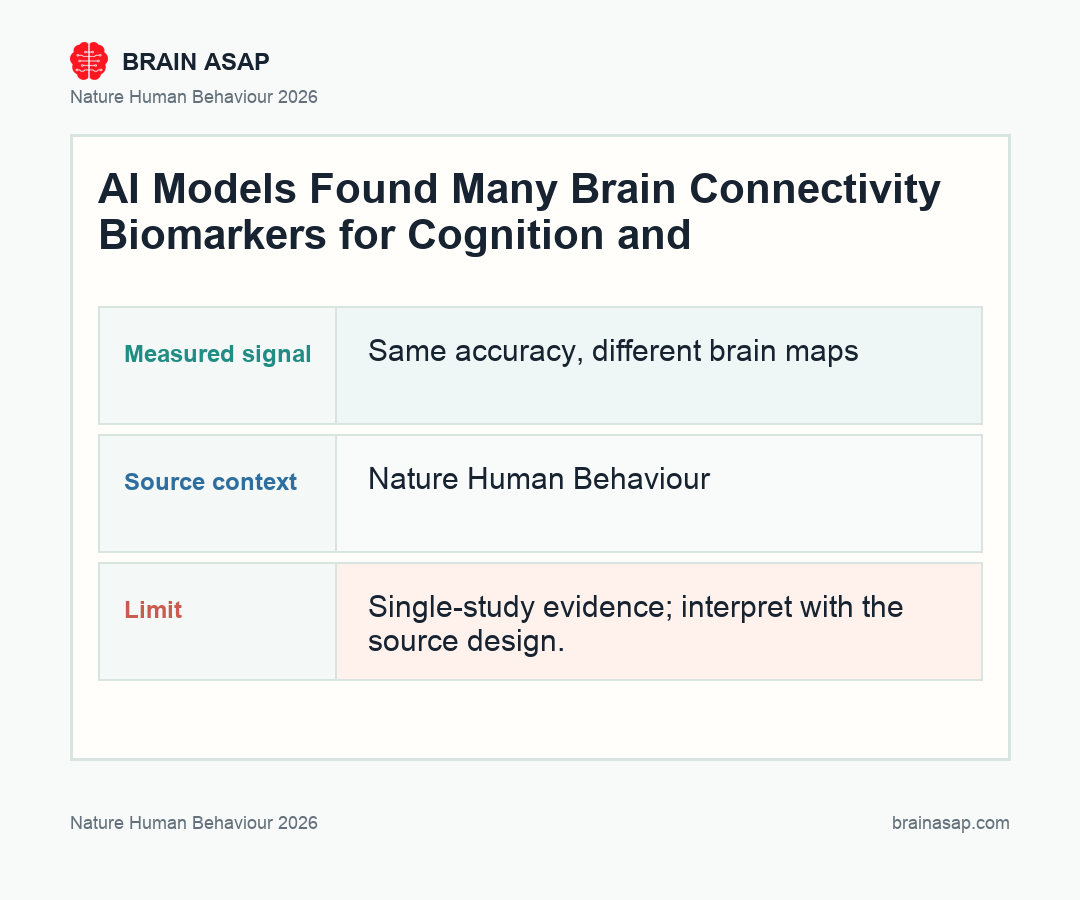
AI Brain Biomarkers Shift When Models Pick Different Features
TL;DR: Across more than 12,000 participants and 13 outcomes, overlooked brain-connectivity features predicted cognition and psychiatric traits nearly as well as top-ranked features, but pointed to different underlying circuits.
Key Findings
- Hidden features held predictive power: The authors tested their idea across HBN, ABCD, HCPD, and PNC, spanning cognitive, developmental, age, sex, and psychiatric phenotypes rather than a single cherry-picked benchmark.
- PNC decile 1 was not uniquely useful: For executive function in the Philadelphia Neurodevelopmental Cohort, the top decile reached r = 0.33, but the second decile reached r = 0.32 and lower-ranked deciles remained significant through the sixth.
- A fifth decile beat the top one: In HCPD executive function, the fifth decile reached r = 0.16 while the first decile reached r = 0.14, showing that the “best” model was not always the one built from the strongest univariate edges.
- Ninth-decile models still generalized: In one external validation test, a ninth-decile PNC executive-function model predicted HCPD scores at r = 0.13, nearly matching the first-decile model at r = 0.14 despite using non-overlapping features.
- 84.64% of second-decile edges were new: Relative to the first decile, most edges in later deciles were not just weaker copies of the same network; they represented largely distinct connectivity patterns that could still carry signal.
- Interpretation drift outpaced accuracy loss: Many deciles delivered similar predictive performance while producing different node and network maps, which means colorful biomarker diagrams may overstate how uniquely a model identifies one brain circuit.
Source: Nature Human Behaviour (2026) | Adkinson et al.
Neuroimaging papers often do two things at once: they make a prediction, then they turn the selected brain features into an account of what circuit “really” drives behavior. This paper shows those two steps may be much shakier than they look, because different sets of discarded features can perform almost as well while implying different neurobiology.
Why Neuroimaging Biomarkers Keep Mistaking Selected Features for Ground Truth
Machine-learning papers in neuroimaging have a habit of turning a prediction pipeline into a mechanistic claim. A model predicts depression, language ability, or craving from brain connectivity, and then the selected edges get labeled as the circuit for that trait.
That move is tempting because high-dimensional connectomes are hard to interpret. Feature selection offers relief: rank the edges, keep the strongest ones, discard the rest, and offer a cleaner explanation. The problem, this paper argues, is that simplification can quietly become oversimplification.
The authors’ basic challenge is simple. What if the discarded edges are not noise at all? What if they carry enough information to build different models with similar performance, but different neuroanatomical stories?
What Happened When 10 Non-Overlapping Connectome Deciles Were Tested
To test that, the team split each training set’s connectivity edges into ten non-overlapping deciles ranked by how strongly each edge related to the target phenotype. The top decile held the most strongly associated features. The bottom deciles held the ones a standard pipeline would usually throw away.
- Decile 1: the strongest one-tenth of brain-connectivity edges, based on their individual relationship to the outcome.
- Deciles 2 through 9: progressively lower-ranked edges that standard feature selection would usually discard before interpretation.
- Decile 10: the weakest-ranked edges, tested separately so the authors could see whether low-ranking features still carried measurable signal.
Then they ran connectome-based predictive modeling on each decile separately. The result is the paper’s headline: predictive utility was not exclusive to the top-ranked features. In PNC executive function, decile 1 reached r = 0.33, decile 2 reached r = 0.32, and significant performance persisted through decile 6.
The same pattern showed up elsewhere. In HCPD executive function, the fifth decile numerically outperformed the first, 0.16 versus 0.14. The gap was small, but it directly challenges the assumption that the highest-ranked edges are always the privileged route to the best model.
How a Ninth-Decile Model Still Survived External Validation
The paper also tested whether these models survived outside the dataset that produced them. Authors carried the decile-based models across datasets, where many attractive neuroimaging interpretations become less convincing.
Instead, the overlooked features kept surviving. In one example the authors highlight, a PNC executive-function model built from the ninth decile still generalized to HCPD almost as well as the first-decile model:
- Ninth-decile model: r = 0.13 in the external HCPD validation.
- First-decile model: r = 0.14 in the same validation setting.
- Interpretive catch: the models did not share the same edges, but both carried enough information to travel.
External validation is where interpretive shortcuts are supposed to get exposed. If low-ranked, discarded features can generalize almost as well as the canonical top-decile model, then the field has less basis than it thinks for declaring one selected network the definitive biomarker.
Similar Accuracy Produced Different Brain Maps
Prediction performance is only half the problem. The more uncomfortable finding is that similar-performing deciles often implied different underlying circuits. For PNC executive function, for example, connectivity between the visual association and frontal-parietal networks stood out in decile 1 but became much less important in later deciles.
The overlap numbers make that concrete. Relative to the first decile, later models kept bringing in new edges rather than simply reusing the same network map:
- Decile 2: 84.64% of edges were new.
- Decile 3: 38.82% of edges were new.
- Decile 5: 22.19% of edges were new.
These were not just trivial variants of one stable biomarker.
That is why the paper’s “tip of the iceberg” metaphor works. A significant model may only reveal the subset of brain-wide signal that happened to rise to the top under one feature-ranking scheme. Another non-overlapping subset can sometimes imply a different mechanism without paying much of an accuracy penalty.
What 84.64% New Edges Says About Brain-Wide Signal
The authors do not argue that feature selection is useless. In ridge-regression analyses, feature selection generally improved performance. What they argue is narrower and more important: once researchers start treating selected features as the unique neurobiology of a phenotype, they are probably saying more than the data justify.
One reason lower-ranked features may remain useful is that brain data are highly autocorrelated in space and time. Strongly phenotype-linked edges also tend to resemble one another. Pooling only the highest-ranked features can therefore concentrate redundant signal, while pooling lower-ranked but less correlated edges can recover similar predictive information.
There is a more cautionary interpretation too. Lower-ranked features may also pick up confounds, sample stereotypes, or other information the model was never supposed to learn. The paper is honest about that ambiguity, which is why it reads as a warning about interpretation, not a celebration of throwing every weak edge into a clinical biomarker.
Why the Result Needs Careful Reading for Psychiatric Biomarkers Before They Reach Clinics
This paper lands hardest in psychiatry, where biomarker claims already outpace reliability. If one decile gives you a “depression network” and another non-overlapping decile gives you a similarly predictive but different map, the field should be much more careful about what those diagrams are actually proving.
The authors also point toward something more constructive. Multiple deciles may work because different subgroups of people are best captured by different feature sets. In other words, some of today’s interpretive instability may be a disguised subtype problem rather than a pure modeling bug.
The possibility is important for any future attempt to use neuroimaging biomarkers in high-stakes settings. Before a model is allowed to influence diagnosis, prognosis, or treatment selection, researchers often need to show not just that it predicts above chance, but that its biological interpretation remains stable across alternative feature sets. Until then, a clean-looking brain map may be less a discovery than a choice the pipeline made on the researcher’s behalf.
Paper: Feature selection leads to divergent neurobiological interpretations of brain-based machine learning biomarkers. Nature Human Behaviour. 2026.. DOI: 10.1038/s41562-026-02447-y
Authors: Adkinson et al.
Study Design: Cohort study
Sample Size: 12,200 participants, 4 datasets, 13 outcomes: The authors tested their idea across HBN, ABCD, HCPD, and PNC, spanning cognitive, developmental, age, sex, and psychiatric phenotypes rather than a single cherry-picked benchmark.
Key Statistic: PNC decile 1 was not uniquely useful: For executive function in the Philadelphia Neurodevelopmental Cohort, the top decile reached r = 0.33, but the second decile reached r = 0.32 and lower-ranked deciles remained significant through the sixth.