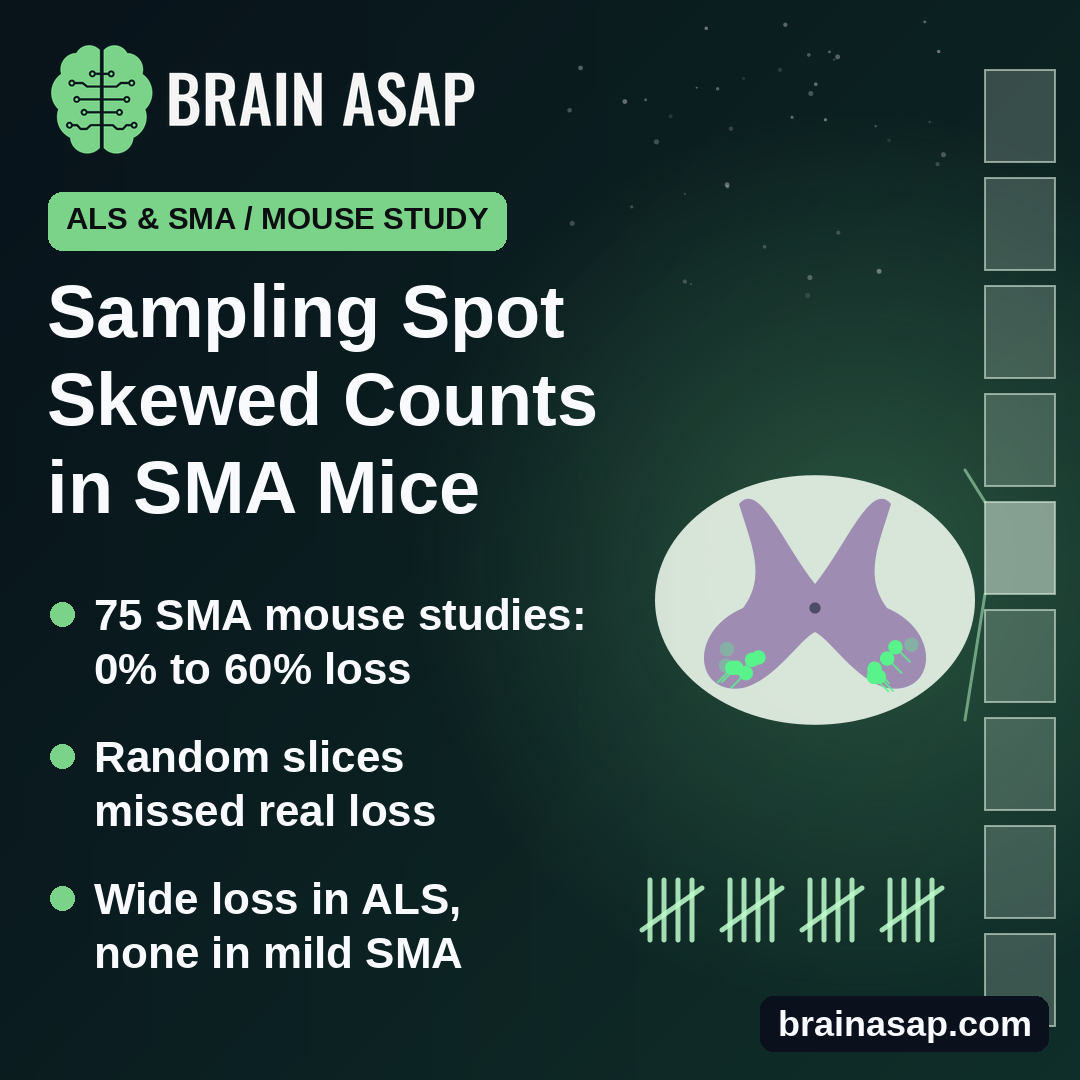
TL;DR: Mouse studies of spinal muscular atrophy have reported anywhere from no loss to 60% loss of motor neurons, and a German-American team found that which slice of spinal cord gets counted explains much of that spread. Counting the right segments with a reliable stain gave clearer pictures of three mouse models.
Key Findings
- 75 studies, wide spread: Reported motor neuron loss in SMA mice ranged from 0% to 60%.
- Sampling spot mattered: Simulated random counts from the lower spine missed real loss in severe SMA mice; counts from the top two lower-back segments caught it every time.
- Two common stains overcounted: They also picked up other nerve cells; the ChAT stain was the most reliable in mouse and human tissue.
- Three different patterns: Wide loss in an ALS model, selective loss in severe SMA, none in a mild SMA model.
Source: Acta Neuropathologica Communications (2026) | Sowoidnich et al.
Motor neurons in the spinal cord carry the final signal from the nervous system to the muscles. In diseases like spinal muscular atrophy (SMA) and ALS, these cells die, and counting how many are lost in mice is a standard way to judge whether a new treatment works.
The trouble is that labs using the same mouse model have reported very different answers. Researchers at Leipzig University, Columbia, Johns Hopkins and Biogen set out to find out why.
Same Mice, Answers From 0% to 60%
The team first pulled together 75 published studies of three widely used SMA mouse models. Reported motor neuron loss ranged from none to 60%. Most studies counted cells somewhere in the lower back region of the spinal cord, but many did not say which segment.
When the researchers sorted the severe-SMA studies by segment, the picture sharpened. Studies of the top two lower-back segments (called L1 and L2) reported much more loss than studies of lower segments, and studies that did not name a segment fell in between.
Where You Count Can Hide the Loss
To test this directly, the team counted every motor neuron across the lower spinal cord of severe SMA mice and healthy littermates. Loss was concentrated in cells that control the trunk and hip muscles, strongest near the top of the lower back. Cells controlling the lower leg and foot were largely spared.
They then fed those counts into a computer simulation of common sampling methods:
- 5 random slices from anywhere in the lower back: No significant loss in any of 4 rounds.
- Every 2nd or 10th slice from a random start: Significant loss in only 1 round, with a small effect.
- 5 random slices from L1 or L2: Significant loss in all 4 rounds.
Common Stains Counted the Wrong Cells
The team also compared the stains used to spot motor neurons. Two older methods, SMI-32 and Nissl, also lit up many nearby interneurons, the spinal cord’s local relay cells. In mice, the extra cells added roughly 160% to 280% on top of the true motor neurons in the L1 segment.
A stain for the enzyme ChAT, which motor neurons use to make their chemical signal, was the most specific in both mouse and human autopsy tissue. One catch: ChAT signal faded in adult mouse tissue that was not preserved by flushing fixative through the blood vessels. A deep-learning program trained on whole, cleared spinal cords matched hand counts closely.
ALS, Severe SMA and Mild SMA Looked Very Different
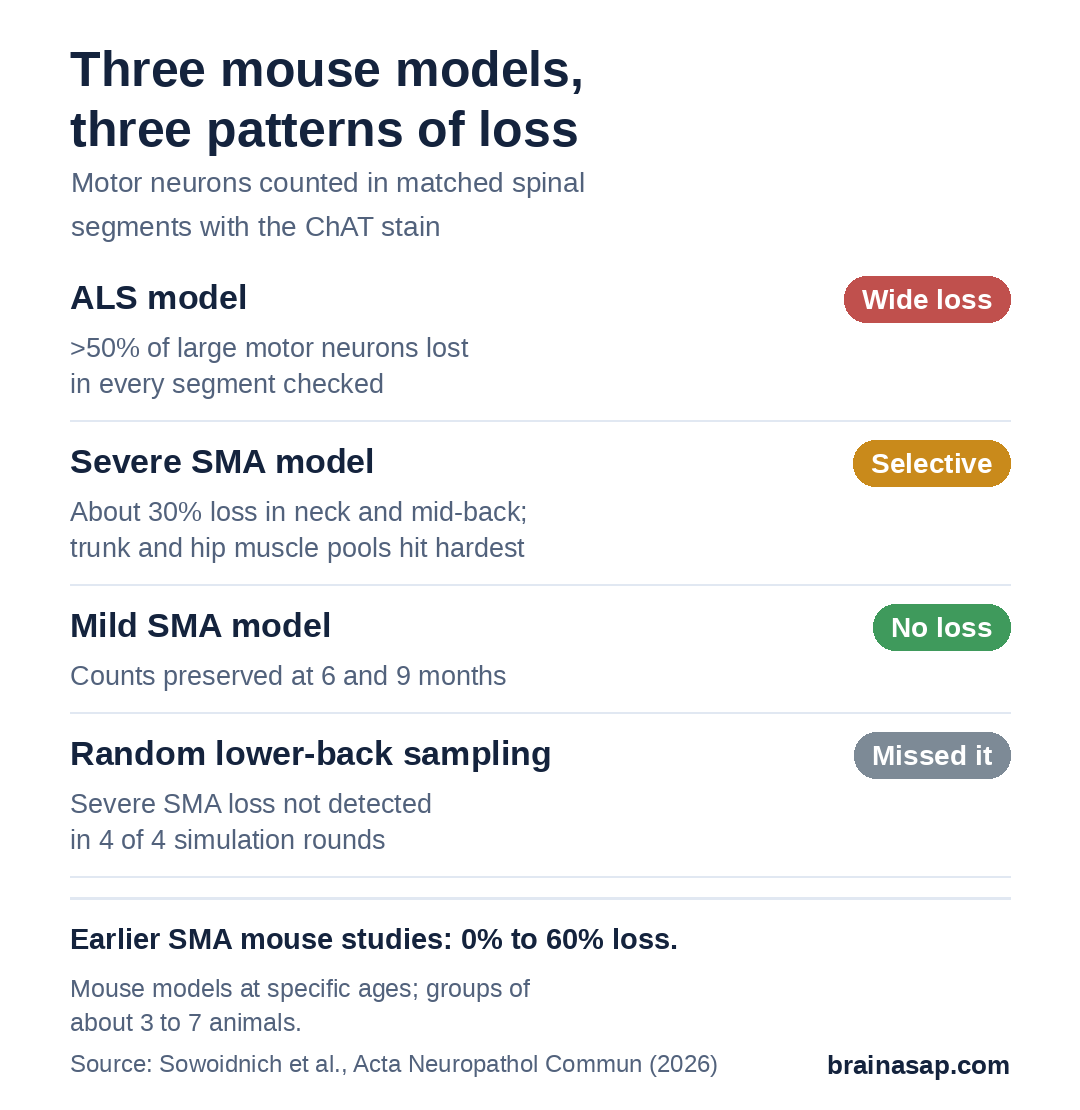
Using the standardized approach, the researchers found:
- ALS model: More than half of the large motor neurons were lost in every segment checked, worst in pools for lower-leg muscles.
- Severe SMA model: About 30% loss in neck and mid-back segments, with loss focused on trunk and hip muscle pools.
- Mild SMA model: No loss at 6 or 9 months of age, even though an earlier study using less specific stains had reported about 30% loss.
Lab Mice and a Lab Method
- Mouse models only: Patterns are specific to these strains and ages, not a guide to any patient’s course.
- Small groups: Mostly 3 to 7 mice per group.
- Literature search ended in 2023: Newer studies were not included.
- Marker limits: ChAT can drop in sick cells, so another marker may be needed in some settings.
- Industry author: One author was a Biogen employee, a company that makes an SMA drug.
A Common Counting Standard Could Make Mouse Trials Easier to Compare
The practical message is for labs: name the spinal segment, use a specific stain, and count the pools that a disease actually hits. Whether journals and drug developers adopt a shared standard like this will decide if future SMA and ALS treatment studies can be compared head to head.
Citation: DOI: 10.1186/s40478-026-02415-7. Sowoidnich L, Norman AL, Gerstner F, et al. A standardized framework resolves ambiguity in motor neuron loss across neurodegenerative diseases. Acta Neuropathol Commun. 2026;14:182.
Study Design: Systematic review and meta-analysis of SMA mouse studies plus laboratory experiments (tissue clearing, segment tracing, marker comparison, deep-learning counts, sampling simulation) in mouse and human spinal cord.
Sample Size: 75 published studies; mouse groups mostly 3 to 7 animals; human autopsy tissue samples.
Key Statistic: Reported motor neuron loss in SMA mice ranged from 0% to 60%; random lumbar sampling missed loss in 4 of 4 simulation rounds.
Caveat: Mouse models at specific ages; not a clinical test or treatment finding.