
TL;DR: A 2026 preprint in medRxiv linked recurrent major depression to direction-specific effective-connectivity changes, with strongest patterns in cerebellar-cortical, sensorimotor, cognitive, neurotransmitter, and oligodendrocyte precursor cell maps.
Key Findings
- 1,627-person discovery dataset: REST-meta-MDD resting-state functional MRI (fMRI) and T1 MRI data compared 839 people with major depression and 788 controls.
- Recurrent depression pattern: First-episode drug-naive depression showed no significant effective-connectivity change, while recurrent depression showed a hyper-driven cerebellar-cerebral pattern.
- Four EC directions: Altered regions included 11 excitatory-input, 16 excitatory-output, 19 inhibitory-input, and 22 inhibitory-output regions.
- OPC bridge: Oligodendrocyte precursor cells were identified as a cellular mediator between molecular maps and macroscopic connectivity changes.
- Treatment response: Medication and neuromodulation produced opposite directional connectivity-response patterns in a small longitudinal dataset.
Source: Ding et al. used effective-connectivity modeling to study recurrent major depressive disorder across imaging, gene-expression, neurotransmitter, cell-type, and treatment-response layers.
Depression brain-imaging studies often describe whether two regions are correlated. This preprint asked a more directional question: which regions appear to drive information flow, which regions receive it, and whether the pattern changes after treatment.
The pattern was not the same for every depression subgroup. Recurrent major depressive disorder carried the strongest EC change, while first-episode drug-naive depression did not.
Effective Connectivity Tracked Directional Brain Signaling in Recurrent Depression
The study focused on effective connectivity (EC), a measure intended to estimate directional influence between brain regions. That differs from standard functional connectivity, which usually tells whether two regions fluctuate together but not which way information is flowing.
Researchers analyzed resting-state functional MRI (fMRI) and T1-weighted MRI from the REST-meta-MDD consortium. The discovery dataset included several comparisons:
- Total MDD vs controls: 839 people with major depression and 788 controls.
- First-episode drug-naive MDD: 227 patients compared with 388 controls.
- Recurrent MDD: 189 patients compared with 423 controls.
- Subtype comparison: 117 first-episode drug-naive patients compared with 72 recurrent patients.
An independent validation cohort included 86 first-episode MDD patients, 33 recurrent MDD patients, and 84 controls.
A separate longitudinal treatment dataset followed 27 people with MDD, split between medication and neuromodulation groups.
The EC method used Liang Information Flow. The analysis separated unsigned connectivity strength from signed directional patterns, then split signed EC into excitatory-like and inhibitory-like inputs and outputs.
First-Episode Depression Did Not Show the Same EC Pattern
One of the most important findings was the subgroup difference. In the first-episode drug-naive comparison, the analysis did not find significant EC changes.
The recurrent depression group looked different. It showed a hyper-driven cerebellar-cerebral EC pattern, with altered information flow between cerebellar regions and cortical sensorimotor or cognitive regions.
The reported direction-specific pattern had two main pieces:
- Sensorimotor and cognitive regions: these regions showed increased inputs, including diminished inhibitory input and increased excitatory output flow.
- Cerebellar output: cerebellar regions showed weakened inhibitory output, interpreted as reduced suppressive control over cortical targets.
The altered regions were not scattered randomly across the model. The preprint reported 11 regions with excitatory-input changes, 16 regions with excitatory-output changes, 19 regions with inhibitory-input changes, and 22 regions with inhibitory-output changes.
Three regions stood out across all four direction-specific EC categories: the rectal gyrus, the fusiform gyrus, and left cerebellar lobule VI.
Middle Cortical Lamina Helped Constrain the Connectivity Map
The imaging analysis did not stop at functional signaling. It also tested whether laminar structural covariance, or similarity in cortical structure across depth layers, helped explain the directional EC alterations.
Cortical layers are not interchangeable. Different depths support different kinds of input, output, and local processing.
Treating the cortex as one uniform block can miss those constraints.
In recurrent depression, laminar structural covariance differences were most notable in the middle cortical lamina. The EC-SC relationships followed several patterns:
- Single-direction coupling: some altered EC routes were tied to one structural-covariance direction.
- Shared-SC bidirectional coupling: some bidirectional EC changes appeared constrained by the same laminar structural feature.
- Distinct-SC bidirectional coupling: other bidirectional EC changes mapped onto different structural-covariance patterns.
The recurrent depression EC pattern was connected to cortical architecture, not only to a statistical fMRI contrast.
Serotonin, GABA, Glutamate, and OPC Maps Matched EC Alterations
The molecular part of the study integrated Allen Human Brain Atlas gene-expression maps with neurotransmitter receptor maps from positron emission tomography (PET) and SPECT studies.
Those maps allowed a spatial test: did the EC pattern align with known biological systems?
Gene-expression analysis found that the first major input component explained 35.2% of variance, while the first major output component explained 29.3% of variance.
Input-related genes were enriched for modulation of chemical synaptic transmission. Output-related genes were linked with synapse structure regulation and cell-junction organization.
The EC maps also aligned with several neurotransmitter systems:
- Serotonin: 5-HT1a, 5-HT1b, and 5-HT2a receptor maps.
- Inhibition and excitation: GABAa and mGluR5 glutamate signaling maps.
- Other maps: cannabinoid CB1, cerebral blood flow, and kappa opioid receptor maps.
Cell-type analysis highlighted oligodendrocyte precursor cells (OPCs). OPC spatial patterns were associated with both input and output EC maps, with reported correlations of r=-0.450 for input and r=0.463 for output after correction.
The chain-mediation models then connected specific molecular routes to EC. One model linked TENM2, GABAa, OPCs, and EC.
Another model linked IL11, OPCs, cerebral blood flow, and EC. Structural-covariance routes did not survive in the same serial mediation framework.
Medication and Neuromodulation Shifted EC in Opposite Directions
The longitudinal treatment sample was small, but it gave the analysis a clinically relevant test. Sixteen participants were in the medication group, and 11 were in the neuromodulation group.
Both treatment groups improved on HAMD depression and HAMA anxiety scales. The neuromodulation group also improved on suicidal-ideation items and anhedonia ratings.
Connectivity-response patterns differed by treatment type. Medication showed significant time-by-direction interactions in 60 unsigned EC regions, 21 positive EC regions, and 20 negative EC regions, while neuromodulation showed interactions in 50 unsigned EC regions, 7 positive EC regions, and 3 negative EC regions.
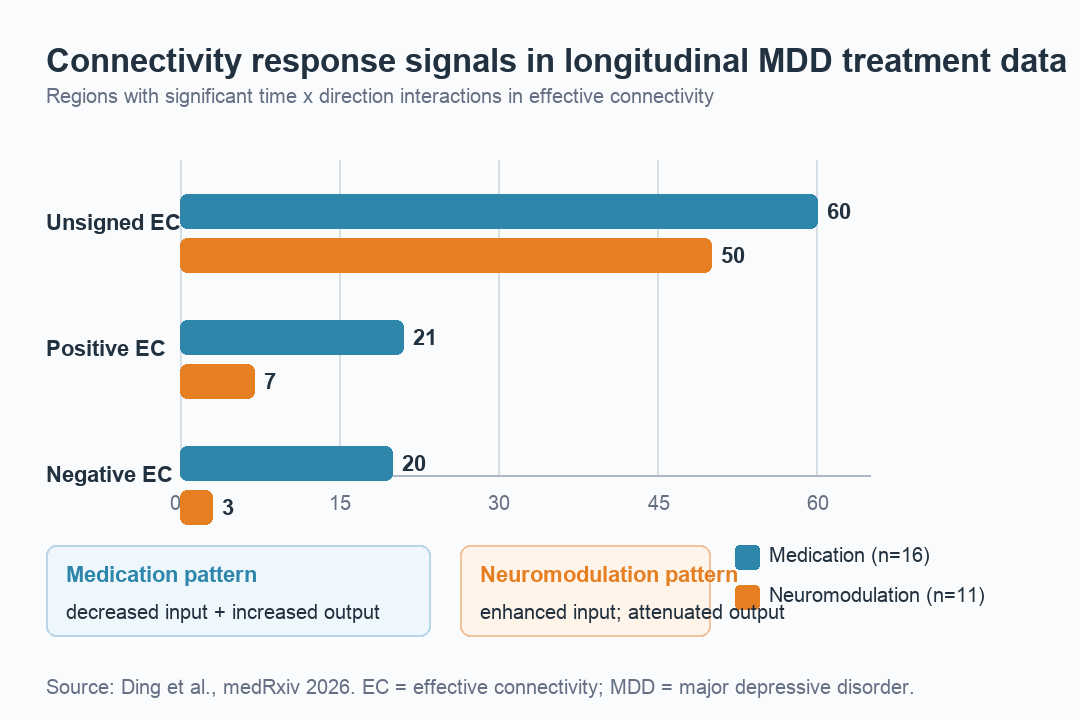
The direction of the response also differed. Medication primarily produced decreased input with increased output. Neuromodulation showed the reciprocal pattern: enhanced input with attenuated output.
EC cannot already choose a treatment for a patient.
Directional connectivity could still become useful in future stratification work, especially for recurrent or refractory depression where standard symptom labels hide biological differences.
Small Treatment Sample Limits Clinical Use of the MDD EC Biomarker
The strongest part of the preprint is the layered design: large discovery imaging data, independent validation, laminar structure, gene expression, neurotransmitter maps, cell-type analysis, and treatment response.
The main caution is that the paper is a preprint and the treatment-response sample was small. A longitudinal dataset of 27 people is useful for hypothesis generation, not for a clinical decision rule.
Another caution is that EC methods estimate directional influence from imaging data. They are not direct recordings of synaptic excitation or inhibition.
The study links EC patterns to neurotransmitter and cell-type maps, but it does not prove a one-to-one cellular mechanism in each patient.
The finding to watch is specific: recurrent depression showed a directional cerebellar-cortical connectivity pattern that lined up with laminar structure, serotonin-GABA-glutamate biology, OPC maps, and different treatment-response directions.
Citation: DOI: 10.64898/2026.05.17.26351714. Ding et al. Direction-specific excitation-inhibition imbalances and their neurobiological substrates in recurrent major depressive disorder. medRxiv. 2026.
Study Design: Resting-state fMRI, structural MRI, laminar structural covariance, gene-expression, neurotransmitter-map, cell-type, mediation, validation, and longitudinal treatment-response analysis.
Sample Size: Discovery N=1,627 from REST-meta-MDD; validation cohort included 86 first-episode MDD, 33 recurrent MDD, and 84 controls; treatment-response dataset included 27 MDD patients.
Key Statistic: Recurrent MDD showed altered regions across 11 excitatory-input, 16 excitatory-output, 19 inhibitory-input, and 22 inhibitory-output maps.
Caveat: The manuscript is a preprint, and the treatment-response analysis used only 16 medication and 11 neuromodulation participants.