TL;DR: A 2026 iScience study used simultaneous EEG-fMRI from 24 healthy adults to build reference maps for slow-wave events (SWEs), brief sleep-related brain waves, and proposed SloCAD as a way to measure how an individual brain deviates from healthy slow-wave network patterns.
Key Findings
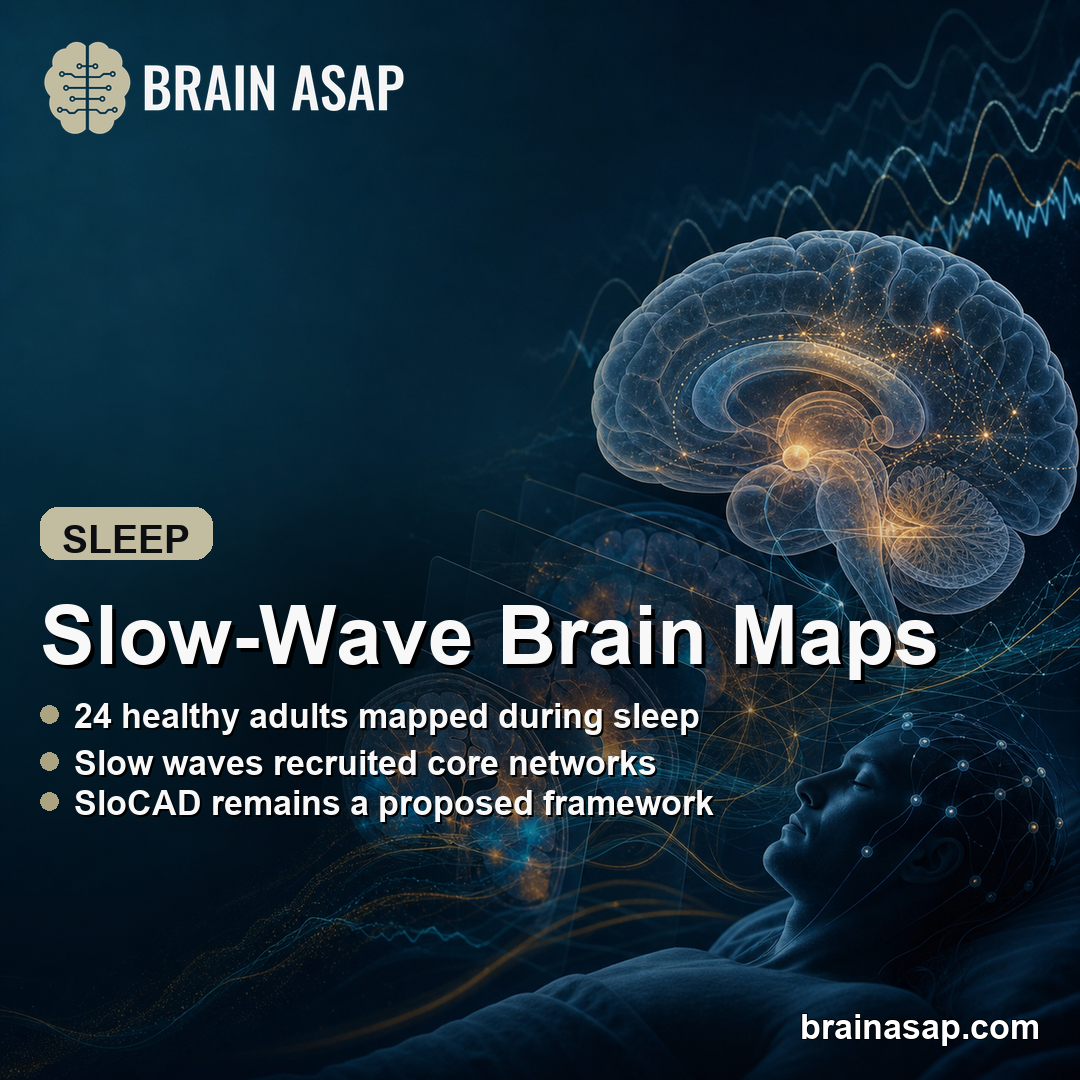
- Two healthy cohorts were mapped: Researchers analyzed simultaneous EEG-fMRI sleep recordings from 24 healthy adults.
- Core slow-wave regions repeated: Canonical SWE-related BOLD activation involved the cingulate cortex, thalamus, hippocampus, and cerebellum.
- Synchronization efficiency changed the map: Higher-synchronization SWEs recruited broader cortical and subcortical networks, while lower-synchronization SWEs were more posterior-cortical.
- SloCAD is a proposed deviation metric: The framework is meant to compare an individual map with a healthy reference map, but it has not been validated as a clinical biomarker.
- Clinical use is still unproven: The maps are a methodological reference point, not a diagnostic atlas for patient care.
Source: The paper appeared in iScience and focused on sleep EEG-fMRI mapping, not diagnosis or treatment.
Slow-wave sleep is often summarized as one deep-sleep measurement, but slow-wave events are not identical each time they occur. Their timing, spread across electrodes, and relationship with brain networks can vary from person to person.
This study tried to turn that variability into a reference framework. Researchers used electroencephalography (EEG) to detect slow-wave events and functional MRI (fMRI) to map related blood-oxygen-level-dependent activity, or BOLD activity, across the brain.
EEG-FMRI Linked Slow Waves to Core Brain Networks
The analysis combined two previously collected healthy-adult sleep datasets. One dataset included 11 adults, and the second included 13 adults, giving a total sample of 24 people.
Researchers modeled each person’s slow-wave events during sleep and then generated individual SWE-related BOLD maps. Those maps were combined into probability and reference maps showing which regions were repeatedly recruited during slow-wave events.
- EEG role: Detect the timing and duration of slow-wave events during sleep.
- fMRI role: Show which brain regions changed BOLD activity around those events.
- Reference-map role: Identify regions that were consistently engaged across healthy adults.
The repeated regions were not limited to one cortical area. Canonical maps included the cingulate gyrus, thalamus, hippocampus, and cerebellum, a pattern consistent with slow waves as network-level events rather than isolated scalp events.
A reference map helps because subtle network dysfunction can be hard to detect when healthy brain organization already varies across individuals. It gives researchers a structured comparison target instead of treating every person’s sleep map as a standalone picture.
Synchronization Efficiency Split Slow Waves Into Different Patterns
The study did not treat all slow waves as one category. Researchers used a synchronization score (SyncS), a measure of how broadly and quickly neural activity is recruited during a slow-wave event.
That score separated slow waves into different spatial patterns. Higher-synchronization SWEs showed broader network recruitment, while lower-synchronization SWEs showed a more limited pattern.
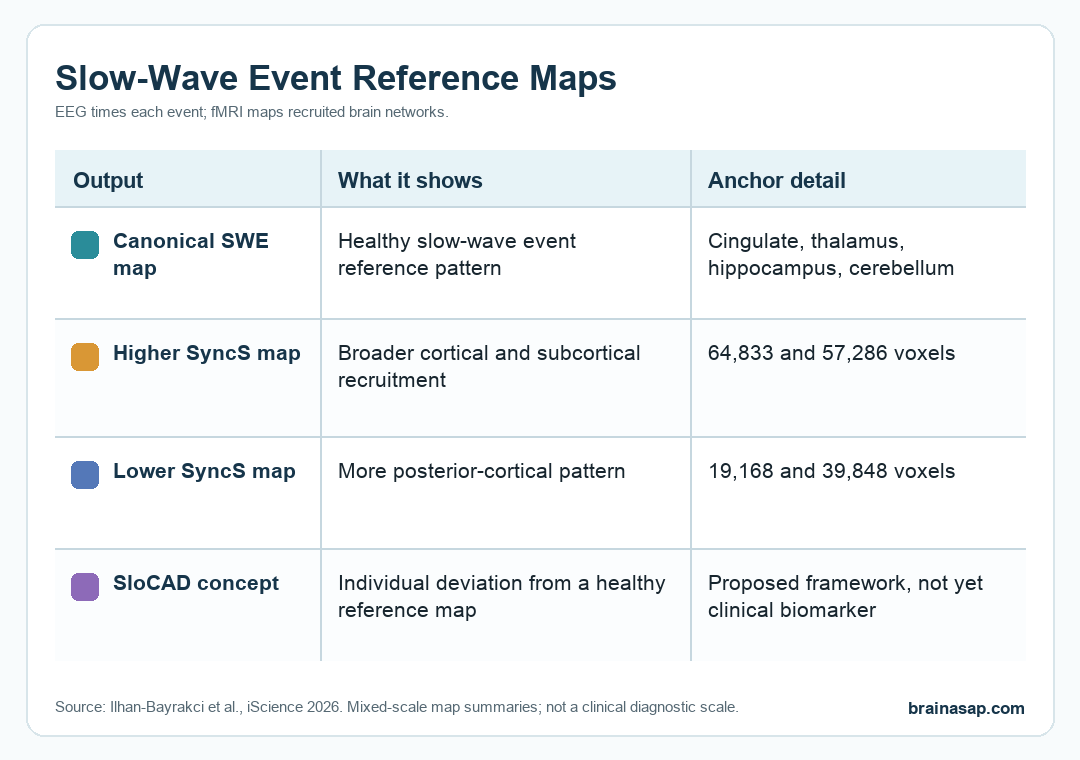
For higher-SyncS events, the masks included 64,833 voxels in dataset 1 and 57,286 voxels in dataset 2. Regions included the anterior cingulate, medial frontal gyrus, temporal gyri, parahippocampal gyrus, thalamus, hippocampus, amygdala, caudate, putamen, and cerebellum.
For lower-SyncS events, the masks were smaller or more posterior in emphasis: 19,168 voxels in dataset 1 and 39,848 voxels in dataset 2. The lower-SyncS pattern involved posterior cingulate, inferior frontal gyrus, precuneus, cuneus, and lingual gyrus, with less subcortical involvement.
- Higher SyncS: Wider recruitment across cortical and subcortical regions.
- Lower SyncS: More posterior-cortical activation and reduced subcortical involvement.
- Spindle coupling check: The broad pattern remained largely unchanged after accounting for whether slow waves were coupled with sleep spindles.
The result does not rank one slow-wave type as better. It says slow waves with different synchronization properties may reflect different network states, which makes a single average slow-wave map less informative than a stratified reference.
SloCAD Would Compare One Person Against a Healthy Map
The central proposal is slow wave canonical activity deviation (SloCAD). SloCAD would calculate how far an individual’s SWE-related BOLD map departs from a healthy reference map.
The proposed comparison asks whether a person’s slow-wave network pattern is still close to the expected healthy pattern or has shifted away from it. The output would be a subject-specific deviation map plus a quantitative deviation metric.
- Step 1: Build healthy reference maps from sleep EEG-fMRI recordings.
- Step 2: Record an at-risk or patient individual’s slow-wave EEG-fMRI pattern.
- Step 3: Subtract the individual map from the healthy reference map to estimate deviation.
- Step 4: Test whether the deviation relates to early network dysfunction or clinical outcomes.
The clinical step is still hypothetical. The study gives a framework and reference masks, not a proven diagnostic test.
SloCAD would need validation in patient cohorts before it could be interpreted as a marker of Alzheimer’s disease, Parkinson’s disease, schizophrenia, insomnia, epilepsy, or any other condition.
The Main Limitation Is Clinical Validation
The strongest part of the study is the multimodal design. EEG gives event timing, while fMRI gives spatial brain-network information.
Together, the two measures can show where slow-wave events are represented in the sleeping brain.
The main limitation is that the study remains a methodological proof of concept. The reference maps came from healthy adults, the total sample was modest, and the framework was not tested on patient data.
The researchers also note a practical barrier: sleep EEG-fMRI is difficult. Scanner noise, movement limits, long recordings, and participant dropout make large datasets uncommon, especially in neuropsychiatric cohorts.
- Not a population atlas: The maps are reference maps from two modest healthy cohorts, not definitive normative standards.
- No patient validation: The paper did not test whether SloCAD distinguishes clinical groups or predicts outcomes.
- Data scarcity: Large sleep EEG-fMRI repositories are still limited, which makes replication and clinical benchmarking harder.
The practical takeaway is narrow: slow-wave events can be mapped as network events, and their synchronization properties change which regions appear in the reference map.
If larger clinical datasets become available, SloCAD gives researchers a concrete framework for testing whether disrupted sleep-wave network patterns mark early brain dysfunction.
Citation: DOI: 10.1016/j.isci.2026.115455. Ilhan-Bayrakci Ilhan-Bayrakci et al. Slow wave canonical activity deviation concept: Toward a slow wave-based EEG-fMRI reference map for health-associated network function. iScience . 2026;29:115455. iScience. 2026.
Study Design: Methodological EEG-fMRI analysis using two healthy-adult sleep datasets to build slow-wave event reference maps.
Sample Size: 24 healthy adults across two cohorts, with 11 people in dataset 1 and 13 people in dataset 2.
Key Statistic: Higher-SyncS slow-wave masks included 64,833 and 57,286 voxels across the two datasets, while lower-SyncS masks included 19,168 and 39,848 voxels.
Caveat: SloCAD is a proposed framework and has not been validated as a clinical biomarker.