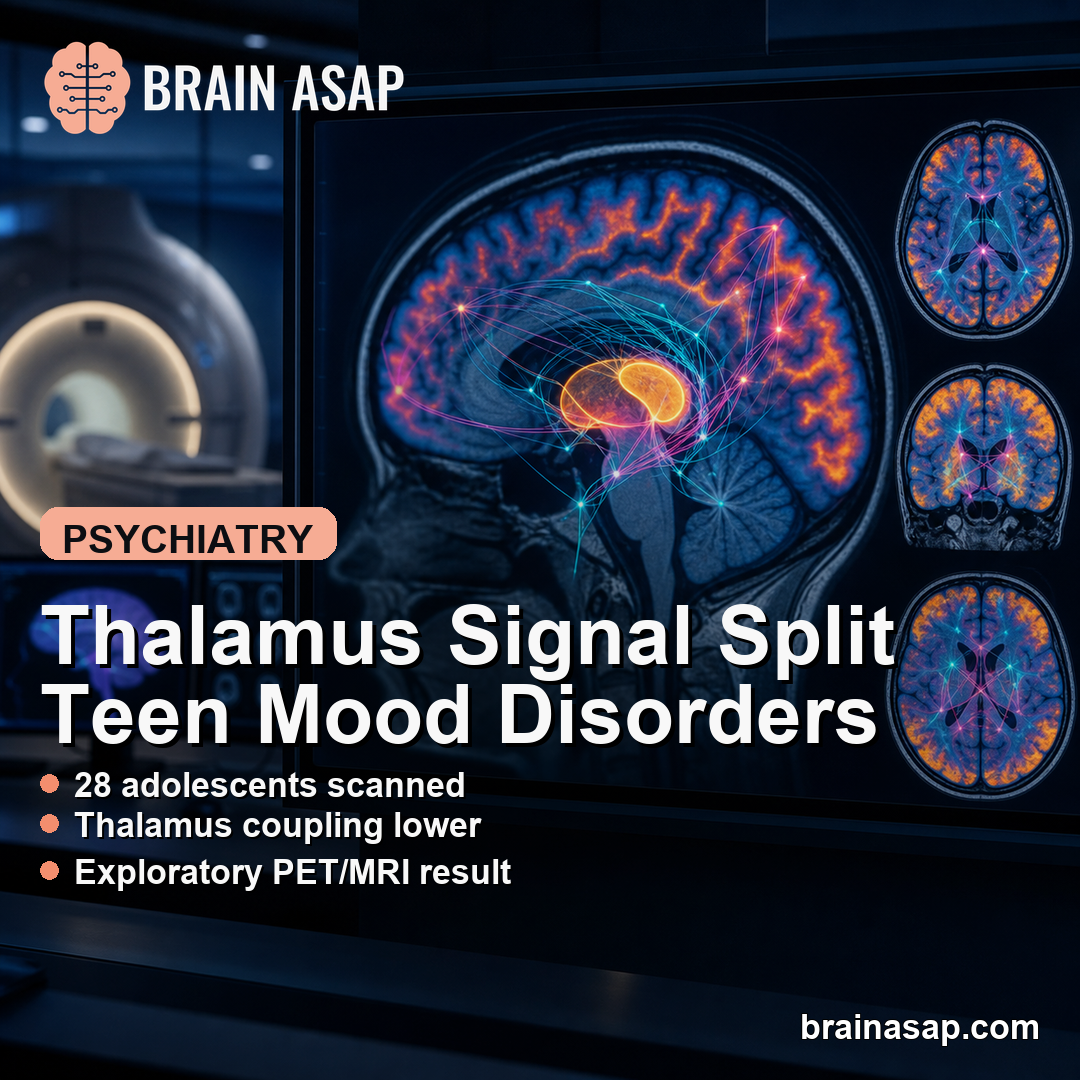
TL;DR: A 2026 study in the European Journal of Nuclear Medicine and Molecular Imaging reported that adolescent bipolar II depression showed lower thalamic structural-functional connectivity coupling and glucose metabolism than adolescent major depressive disorder in a small exploratory positron emission tomography/MRI (PET/MRI) sample.
Key Findings
- 28 adolescents scanned: The study compared 14 adolescents with bipolar II disorder in a depressive episode and 14 adolescents with major depressive disorder.
- Lower thalamic coupling: The bipolar disorder group showed lower thalamic structural-functional connectivity coupling than the major depression group.
- Lower thalamic metabolism: The bipolar disorder group also showed lower [18F]FDG glucose metabolism in the thalamus.
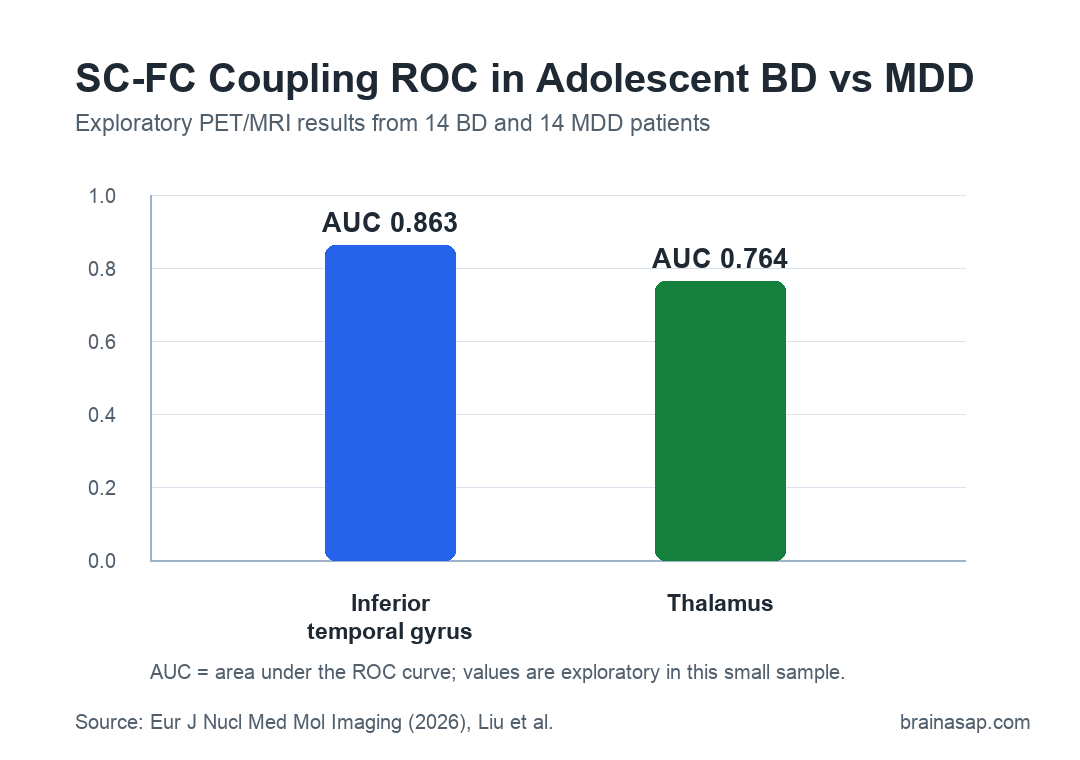
- ROC AUC 0.863: In the detailed ROC section, inferior temporal gyrus SC-FC coupling had an AUC of 0.863 for separating the two groups.
- No FDR-surviving regional tests: Several regional findings were nominally significant, but the SC-FC and correlation results did not survive false-discovery-rate correction.
Source: European Journal of Nuclear Medicine and Molecular Imaging (2026) | Liu et al.
Adolescent bipolar disorder can look like major depressive disorder when the young person is seen during a depressive episode. That diagnostic overlap is clinically important because bipolar depression, major depression, and ordinary adolescent mood instability can require different treatment decisions.
Researchers tested whether multimodal brain imaging might show exploratory differences between the two groups. The study focused on structural-functional connectivity coupling, or SC-FC coupling, which measures how closely structural wiring patterns line up with functional activity patterns.
Adolescent Bipolar II and Major Depression Groups Were Small
The study enrolled 14 adolescents with bipolar disorder and 14 adolescents with major depressive disorder from Shanghai Tenth People’s Hospital. The bipolar group had bipolar II disorder at enrollment, with at least one hypomanic episode and one major depressive episode, and all participants were in a depressive episode during scanning.
Researchers used several clinical and imaging inputs:
- HAMD-17: The 17-item Hamilton Depression Scale, used to measure depressive-symptom severity.
- HCL-32: The Hypomania Check List, used to identify hypomanic symptoms in the bipolar group.
- DTI: Diffusion tensor imaging, used to estimate structural connectivity from white-matter pathways.
- Resting-state fMRI: Functional MRI at rest, used to estimate functional connectivity.
- [18F]FDG PET: A glucose-metabolism positron emission tomography scan, used as a metabolic measure of regional brain activity.
The groups were similar in age, education, sibling status, and sex distribution, although the sample was female-predominant. HAMD and HCL scores were both higher in the bipolar group, indicating more severe depressive and hypomanic symptom scores in that group.
Thalamus SC-FC Coupling Was Lower in Bipolar Depression
Compared with the major depression group, adolescents with bipolar depression showed lower SC-FC coupling in several regions, including the middle temporal gyrus, inferior temporal gyrus, and thalamus. The cingulate gyrus showed higher SC-FC coupling in the bipolar group.
The thalamus is a relay and integration hub involved in sensory processing, cognition, emotion regulation, and thalamocortical network coordination. In this study, lower thalamic coupling appeared alongside lower thalamic glucose metabolism in the bipolar group.
The metabolic comparison showed the strongest reductions in the bipolar group in three regions:
- Thalamus: Lower glucose metabolism in the bipolar group, with p = 0.006 in the regional comparison.
- Angular gyrus: Lower metabolism in the bipolar group, with p = 0.010.
- Striatum: Lower metabolism in the bipolar group at nominal p < 0.05.
These results fit the paper’s broader interpretation that thalamic abnormalities may help distinguish adolescent bipolar depression from major depression. They should still be treated as exploratory because the sample was small and multiple-comparison correction weakened the regional evidence.
Inferior Temporal Gyrus Had the Stronger ROC Result
The receiver operating characteristic (ROC) analysis tested whether features from regions that differed between groups could separate bipolar depression from major depression. In the detailed ROC section, inferior temporal gyrus SC-FC coupling had an AUC of 0.863, while thalamic SC-FC coupling had an AUC of 0.764.
AUC, or area under the ROC curve, ranges from 0.5 for chance-level separation to 1.0 for perfect separation. Here, the values suggest potential separation in this dataset, not a clinically validated diagnostic test.
The paper also compared structural and functional links between these regions and emotion-related networks. For the thalamus, the bipolar group showed higher thalamus-prefrontal functional connectivity but lower thalamus-hippocampus functional connectivity than the major depression group.
Clinical Correlations Differed Between Bipolar and Major Depression
Researchers examined whether SC-FC coupling related to depression, hypomania, and suicide scores. The strongest regional correlations differed by diagnosis, which supported the authors’ view that similar depressive symptoms may rest on different network patterns.
The main reported patterns were:
- Depression scores: The strongest bipolar-group correlation with HAMD was in the superior parietal lobule, while the strongest major-depression correlation was in the precentral gyrus.
- Hypomania scores: The strongest bipolar-group correlation with HCL was in the postcentral gyrus, while the strongest major-depression correlation was in the orbital gyrus.
- Suicide scores: In regions with group-level SC-FC differences, the middle temporal gyrus and parahippocampal gyrus correlated with suicide scores only in the bipolar group.
Those correlations are not enough to predict individual risk. They do suggest which networks may deserve closer follow-up in larger adolescent mood-disorder imaging cohorts.
FDR Correction and Diagnosis Stability Limit the Claim
The most important boundary is statistical. The SC-FC group differences and regional correlations were nominal findings, and the paper states that they did not remain significant after false-discovery-rate correction.
Several additional limits matter:
- Small sample: The study included only 28 adolescents, which limits statistical robustness and ROC reliability.
- Baseline bipolar II diagnosis: Bipolar II diagnosis in adolescence can change with longitudinal follow-up, and the scans reflected one baseline diagnostic timepoint.
- Sex imbalance: The cohort was predominantly female, which may limit generalizability.
- Atlas-based regions: Brain-region definitions may have hidden more granular thalamic or temporal-subregion effects.
The narrow result is that, in this small adolescent PET/MRI study, thalamic SC-FC coupling and thalamic metabolism were lower in bipolar depression than in major depression, and SC-FC coupling features looked more discriminating than glucose metabolism alone.
Citation: DOI: 10.1007/s00259-026-08023-w. Liu et al. Brain structural-functional connectivity coupling and glucose metabolism in adolescents with bipolar disorder and major depressive disorder. European Journal of Nuclear Medicine and Molecular Imaging. 2026.
Study Design: Cross-sectional exploratory PET/MRI comparison of adolescents with bipolar II depression and major depressive disorder.
Sample Size: 14 adolescents with bipolar disorder and 14 adolescents with major depressive disorder.
Key Statistic: Detailed ROC results listed AUC = 0.863 for inferior temporal gyrus SC-FC coupling and AUC = 0.764 for thalamic SC-FC coupling.
Caveat: The regional results were exploratory, did not survive FDR correction, and require larger longitudinal validation.