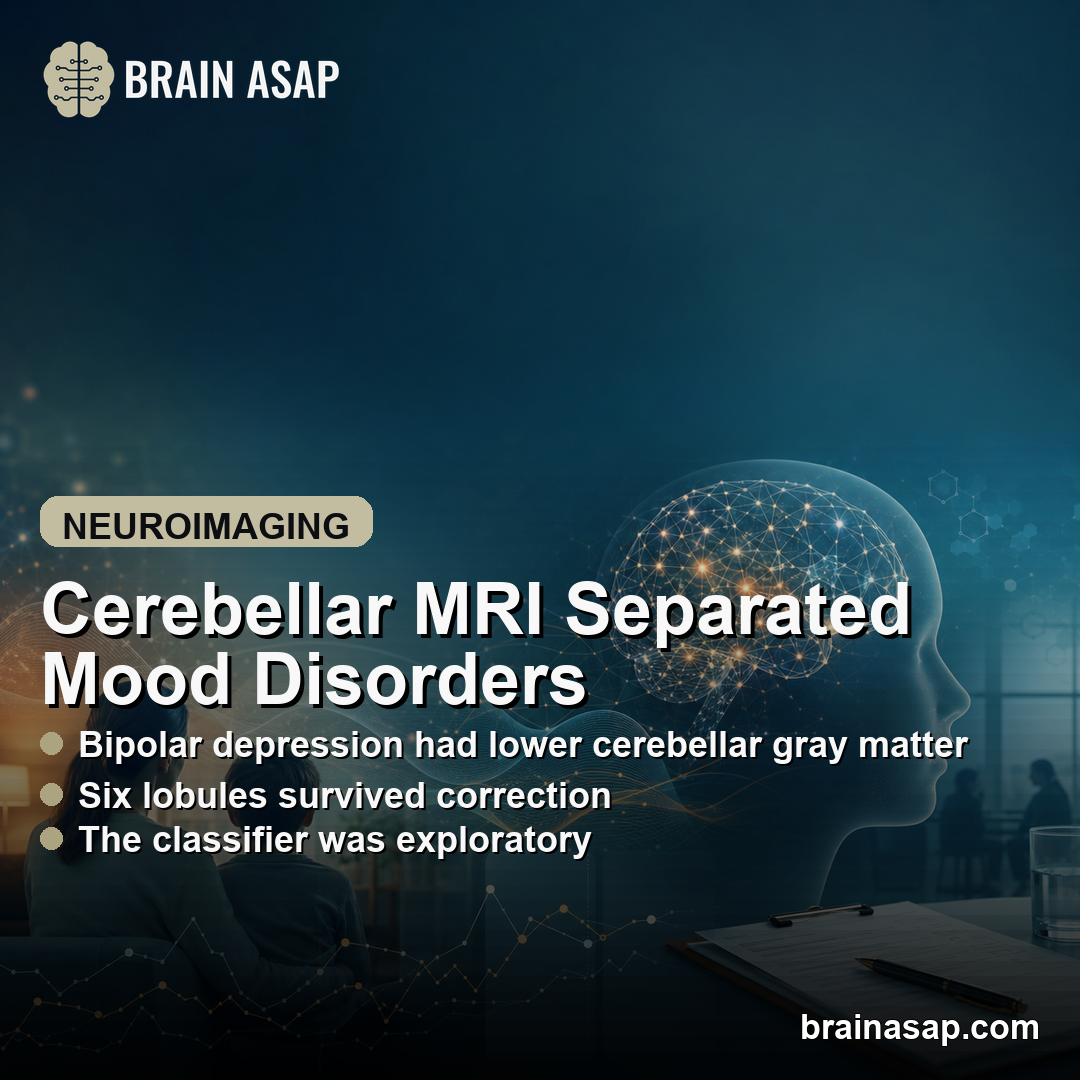
TL;DR: A 2026 study in BMC Psychiatry found that structural MRI of the cerebellum separated first-episode bipolar depression from unipolar depression with 76.3% exploratory model accuracy, mainly because several cerebellar gray-matter regions were smaller in bipolar depression.
Key Findings
- MRI cohort included three groups: Researchers analyzed structural MRI from 42 bipolar depression patients, 48 unipolar depression patients, and 83 healthy controls.
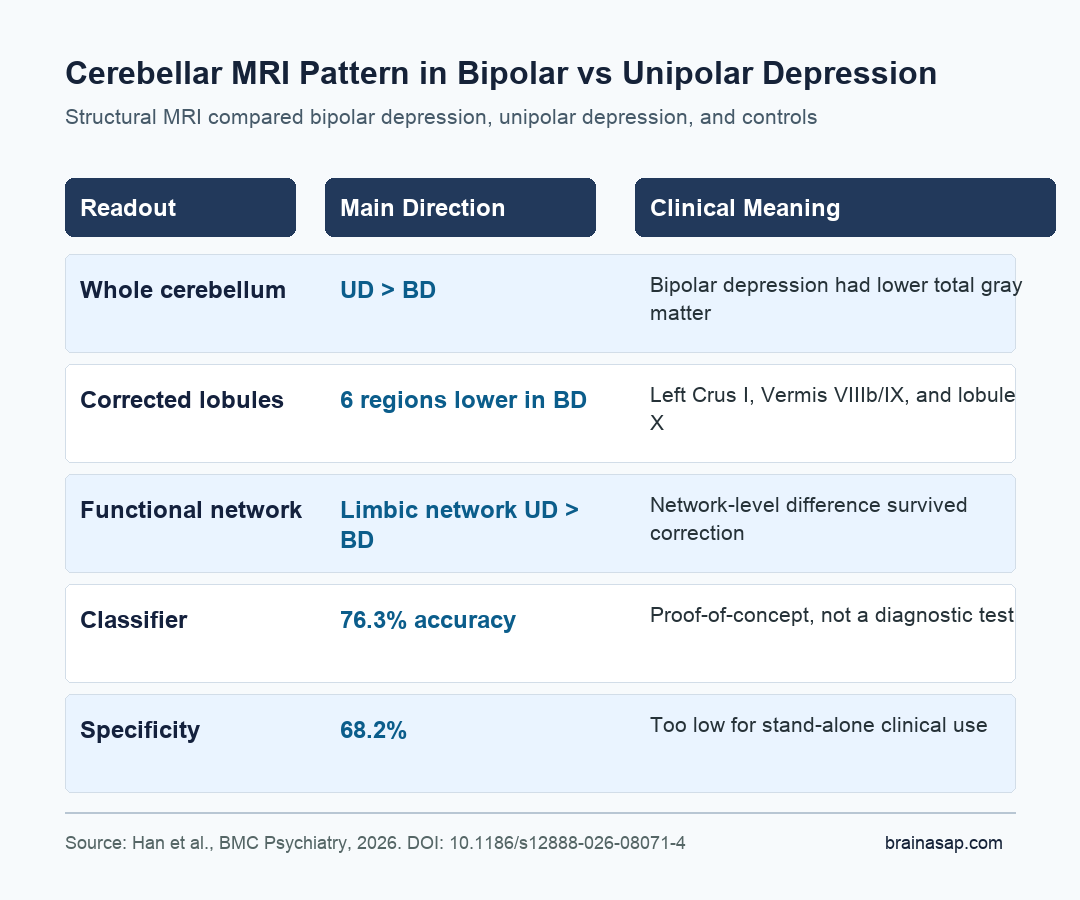
- Bipolar depression showed smaller cerebellar volume: Whole-cerebellum gray matter was lower in bipolar depression than in unipolar depression, and bipolar depression was also lower than healthy controls.
- Six cerebellar regions survived correction: ROI analysis found smaller volumes in bipolar depression in Left Crus I, Vermis VIIIb, Vermis IX, Left X, Vermis X, and Right X.
- Network-level differences also appeared: The unipolar depression group had higher cerebellar limbic-network gray matter than the bipolar depression group after false-discovery-rate correction.
- The classifier was not clinic-ready: An XGBoost model using the significant cerebellar lobules reached 76.3% accuracy, 83.0% sensitivity, and 68.2% specificity, making it proof-of-concept rather than a diagnostic test.
Source: BMC Psychiatry (2026) | Han et al.
Cerebellar MRI Targeted a Common Diagnostic Problem
Bipolar depression and unipolar depression can look similar during a depressive episode, but the treatment implications are not the same. The study focused on that diagnostic overlap rather than treating depression as one broad category.
Researchers recruited adults ages 18 to 45 and used DSM-5 structured clinical interviews to separate bipolar disorder, unipolar depression, and healthy-control groups.
Unipolar depression meant a first lifetime major depressive episode. Bipolar depression meant the first depressive episode after a recognized manic, mixed, or hypomanic episode.
The definition keeps the claim narrow. The paper was not claiming to predict future bipolar conversion in people who currently have unipolar depression; it compared already-diagnosed bipolar depression with unipolar depression during depressive presentations.
- Bipolar depression group: 42 patients with bipolar I or bipolar II disorder during a depressive episode.
- Unipolar depression group: 48 patients with a first lifetime major depressive episode.
- Healthy-control group: 83 people without neurological or psychiatric history.
The SUIT Atlas Split the Cerebellum Into Lobules and Networks
The cerebellum is often treated as a movement structure, but it is also connected with emotional regulation, attention, default-mode processing, and cognitive control. That made it a plausible target for separating mood-disorder subtypes.
Researchers used 3.0T structural MRI, then processed cerebellar gray matter with the Spatially Unbiased Infratentorial Toolbox (SUIT). SUIT is a cerebellum-specific MRI toolkit that improves alignment and parcellation for the cerebellum compared with ordinary whole-brain processing.
The analysis had two levels:
- Anatomical lobules: The SUIT probabilistic atlas divided the cerebellum into 28 lobules.
- Functional networks: The Buckner-Yeo cerebellar map grouped gray matter into 7 functional networks, including dorsal attention, default mode, and limbic networks.
- Voxel-level checks: Voxel-based morphometry tested whether smaller regions appeared at a finer spatial scale.
The statistical models adjusted for age, sex, education, marital status, and intracranial volume. Anxiety scores were also tested as an extra covariate, and the bipolar-versus-unipolar cerebellar differences remained.
Bipolar Depression Had Lower Cerebellar Gray Matter Than Unipolar Depression
The main result was directional and fairly easy to summarize: unipolar depression showed larger cerebellar gray-matter volume than bipolar depression. Whole-cerebellum analysis found significant group differences, with bipolar depression lower than both unipolar depression and healthy controls.
Voxel-level analysis identified smaller bipolar-depression clusters with peaks in Vermis IX, Vermis VI, and Left VI.
ROI analysis broadened the picture. Compared with unipolar depression, bipolar depression had lower gray matter in nine cerebellar regions, and six survived false-discovery-rate correction.
Those corrected regions were:
- Left Crus I: A posterior cerebellar region often linked with cognitive and default-mode functions.
- Vermis VIIIb and Vermis IX: Midline cerebellar regions the researchers tied to affective and sensorimotor-affective regulation.
- Left X, Vermis X, and Right X: Lobule X regions that contributed to the bipolar-versus-unipolar separation.
At the network level, the bipolar group had lower gray matter in the dorsal attention network and default mode network compared with healthy controls after correction. The direct patient-group comparison also showed higher limbic-network gray matter in unipolar depression than bipolar depression.
The Machine-Learning Result Was Informative but Not Diagnostic
The researchers then asked whether the cerebellar measures could classify bipolar depression versus unipolar depression. They used XGBoost, a machine-learning method for structured data, with repeated 5-fold cross-validation.
The best-performing model used cerebellar lobules that differed significantly between the bipolar and unipolar groups. It reached 76.3% accuracy, 83.0% sensitivity, 68.2% specificity, and an AUC of 0.779.
A model using all lobules performed similarly, while a model using nonsignificant lobules performed worse.
Specificity is the key limitation. A tool that misses too many unipolar cases or overcalls bipolar disorder would not be acceptable as a stand-alone clinical test.
The researchers also did not validate the classifier in an external cohort, so overfitting remains possible.
- Best signal: Significant cerebellar lobules produced the strongest sensitivity.
- Main weakness: Specificity was only 68.2%, below a practical clinical threshold.
- Interpretation: The model supports a biomarker hypothesis, not clinical deployment.
The Limits Are Important for Reading the Result
The evidence measured a concrete neuroanatomical pattern in a clinically relevant comparison. It does not prove that cerebellar MRI can diagnose bipolar depression in ordinary practice.
Several limits narrow the claim. The sample was modest, the healthy controls were older than the patient groups, and detailed medication histories were not available for all bipolar participants.
Some bipolar patients may have received psychopharmacological treatment before scanning because their depressive episode followed a prior manic or hypomanic episode.
Another important limit is follow-up. None of the unipolar depression patients converted to bipolar disorder during a 2-year follow-up, but later conversion is still possible.
A stronger clinical test would need larger samples, longer follow-up, and external replication.
The clinical claim is narrower: cerebellar gray-matter patterns may help explain why bipolar and unipolar depression differ biologically even when depressive symptoms look similar.
The next step is not immediate diagnostic use, but replication in larger first-episode cohorts with richer treatment and longitudinal data.
Citation: DOI: 10.1186/s12888-026-08071-4. Han et al. Cerebellar gray matter volume difference in first-episode bipolar and unipolar depression. BMC Psychiatry. 2026.
Study Design: Cross-sectional structural MRI study with cerebellar lobule, functional-network, voxel-based, and exploratory machine-learning analyses.
Sample Size: 42 bipolar depression patients, 48 unipolar depression patients, and 83 healthy controls.
Key Statistic: XGBoost using significant cerebellar lobules reached 76.3% accuracy, 83.0% sensitivity, 68.2% specificity, and 0.779 AUC for bipolar-versus-unipolar classification.
Caveat: The classifier lacked external validation, and the modest sample plus incomplete medication histories limit clinical interpretation.