TL;DR: A 2026 study in Population Health Metrics used Global Burden of Disease 2019 estimates and found that U.S. substance-use-disorder health loss rose sharply from 1990 to 2019, with opioid use disorders driving the largest increase.
Key Findings
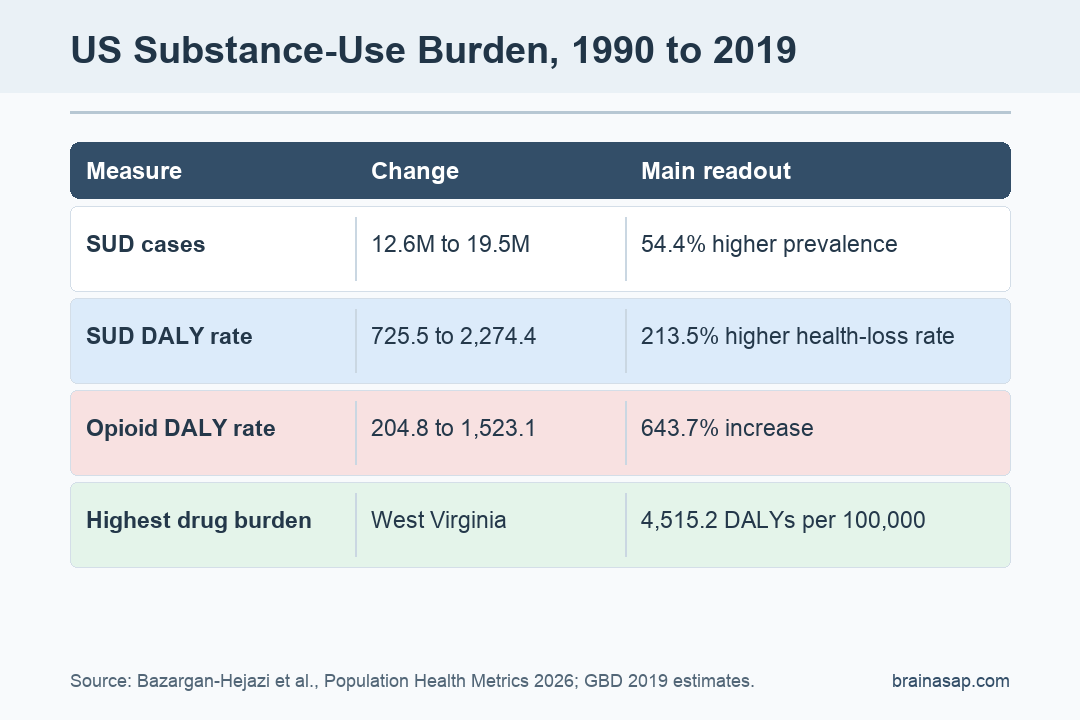
- 19.5 million cases: Estimated U.S. substance use disorder prevalence increased from 12.6 million in 1990 to 19.5 million in 2019.
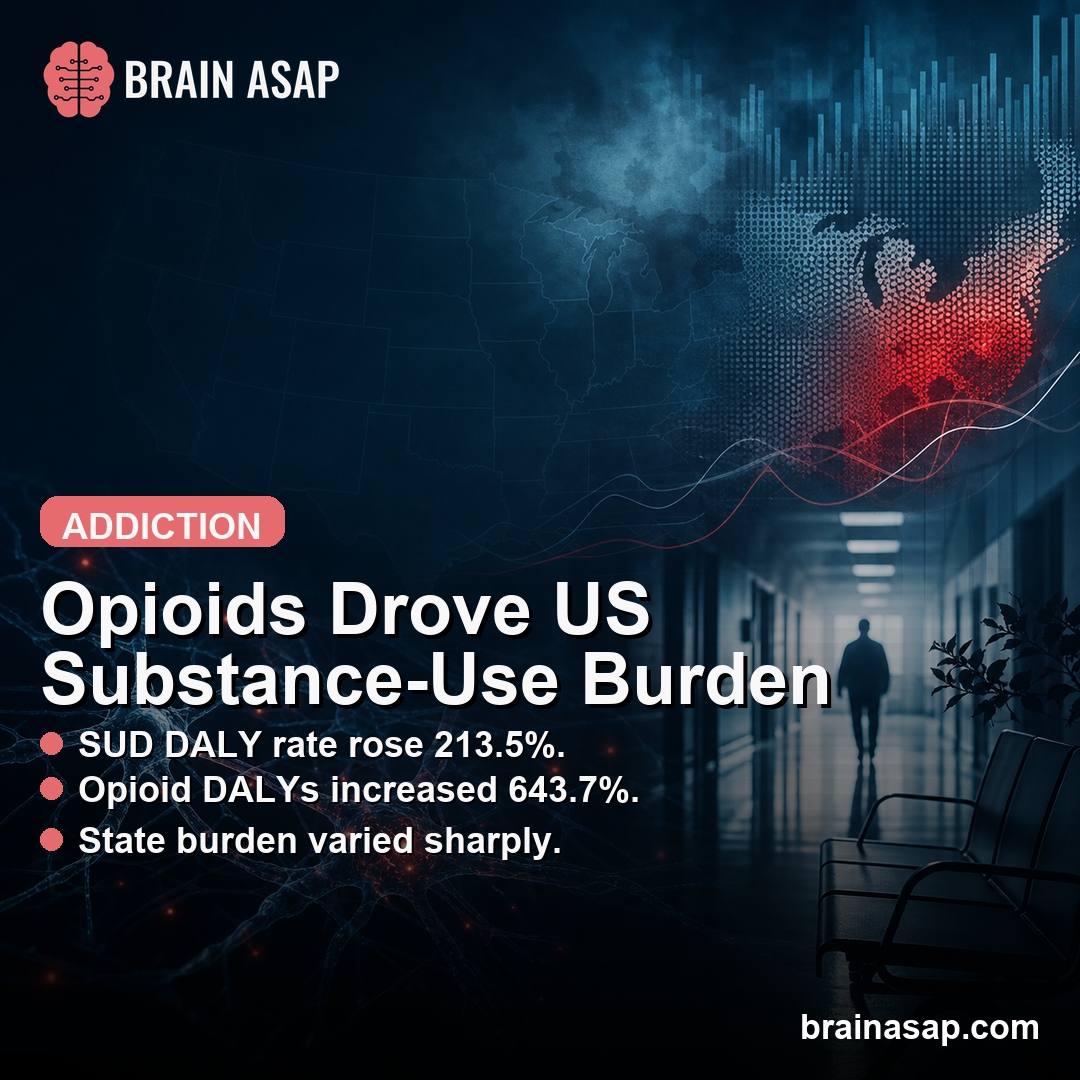
- 213.5% DALY increase: The age-standardized disability-adjusted life year rate increased from 725.5 to 2,274.4 per 100,000 population.
- Opioids led the shift: Opioid use disorder prevalence increased 618.5%, while the opioid-related DALY rate increased 643.7%.
- Men had higher 2019 burden: The 2019 SUD-related DALY rate was 2,486.8 per 100,000 among males versus 1,722.6 among females.
- State gaps were large: Drug-related DALY rates were highest in West Virginia, Kentucky, and Ohio, and lowest in Nebraska, South Dakota, and North Dakota.
Source: Population Health Metrics (2026) | Bazargan-Hejazi et al.
Substance use disorders (SUDs) are usually counted by diagnoses, deaths, or survey prevalence.
This study used a broader measure: disability-adjusted life years, or DALYs, which combine years lived with disability and years of life lost to premature death.
DALYs help show when a condition becomes more damaging even if prevalence alone does not capture the full change. In this analysis, U.S. SUD burden increased much faster than case counts.
GBD 2019 Estimates Tracked Substance Use Burden for 30 Years
Researchers used Global Burden of Disease Study 2019 estimates for the United States from 1990 through 2019. They examined alcohol, opioid, cocaine, amphetamine, cannabis, and other drug use disorders by year, sex, age, and state.
The main outcome was the age-standardized DALY rate per 100,000 population. Age standardization makes the comparisons less distorted by population aging or shifts in age structure over the 30-year period.
The analysis also compared policy environments for selected high-burden and low-burden states. Those policy comparisons were descriptive, so they should not be read as proof that a specific law caused a lower or higher burden.
Substance Use Disorder DALYs Rose Faster Than Prevalence
Estimated prevalent SUD cases increased from 12.6 million in 1990 to 19.5 million in 2019, a 54.4% increase. The DALY rate moved much more sharply, from 725.5 to 2,274.4 per 100,000 population.
That gap means the public-health burden was not just a matter of more people meeting disorder definitions. More severe disability, premature mortality, or both were contributing to a larger share of health loss.
The substance-specific pattern was uneven:
- Opioid use disorders: Prevalence increased 618.5%, and the age-standardized DALY rate increased 643.7%.
- Cocaine use disorders: Prevalence rose 50.5%, but the DALY rate rose 142.0%.
- Amphetamine use disorders: Prevalence rose 40.3%, while the DALY rate rose 199.1%.
- Alcohol use disorder: Prevalence and DALY rates changed only modestly compared with opioids and stimulants.
- Cannabis use disorder: Prevalence rose 16.8%, while the age-standardized DALY rate was essentially unchanged.
Opioid Burden Peaked in Early Adulthood
Age patterns were not the same for every substance. In 2019, total SUD-related DALYs were highest in early and middle adulthood, with the largest overall burden in the 20-39 age range.
Opioid-related DALYs peaked earlier, with the highest burden at ages 25-29 years: 5,586.4 per 100,000 among males and 3,071.6 per 100,000 among females. Alcohol use disorder had a later age profile, peaking at ages 45-49 years at 915.0 per 100,000 among males and 402.8 per 100,000 among females.
State-Level Drug and Alcohol Burden Varied Widely
State differences were large. For drug use disorders excluding alcohol, West Virginia had the highest 2019 age-standardized DALY rate at 4,515.2 per 100,000, followed by Kentucky at 3,560.7 and Ohio at 3,140.4.
The lowest drug-use-disorder DALY rates appeared in Nebraska (966.3), South Dakota (1,030.6), and North Dakota (1,062.3). Alcohol-related burden followed a different map, with New Mexico, Alaska, and the District of Columbia at the high end.
The policy review found that lower-burden drug states tended to have several prevention-oriented policies in place:
- Good Samaritan laws: Legal protections meant to reduce fear of seeking emergency help during overdose events.
- Naloxone access: Policies that support wider availability of opioid-overdose reversal medication.
- Prescription monitoring: Prescription drug monitoring programs with faster data uploads and interstate sharing.
- Alcohol-harm policies: Dram shop, social-host, or sales-related rules aimed at reducing alcohol-related injury burden.
The study authors were careful about interpretation. Policy presence alone did not consistently map onto lower burden, and implementation, treatment access, economic conditions, drug supply, and structural inequality can all shape state-level outcomes.
The Main Message Is Severity, Not Just Case Counts
The useful lesson is that SUD burden should not be tracked only as prevalence.
Between 1990 and 2019, the U.S. saw a much larger rise in health loss than in estimated cases, especially for opioid, cocaine, and amphetamine use disorders.
The burden pattern supports prevention, treatment, harm reduction, and recovery systems that are responsive to severity and mortality.
Case counts alone are not enough. A state needs different priorities if the largest burden is early-adult opioid mortality, midlife alcohol harm, or stimulant-related disability.
GBD estimates are modeled, not direct counts from one registry. Still, the analysis gives a consistent 30-year frame for seeing how the substance-use burden changed across substances, sexes, ages, and states.
Citation: DOI: 10.1186/s12963-026-00476-3. Bazargan-Hejazi et al. The changing landscape of substance use disorders over 30 years: insights on US state disparities and policy from the global burden of disease study. Population Health Metrics. 2026.
Study Design: Descriptive epidemiologic analysis using Global Burden of Disease 2019 estimates and selected state policy data.
Sample Size: U.S. state and national modeled estimates for substance use disorder burden from 1990 to 2019.
Key Statistic: Age-standardized SUD-related DALY rate increased 213.5%, from 725.5 to 2,274.4 per 100,000 population.
Caveat: State policy comparisons were descriptive and cannot prove that specific policies caused lower or higher burden.