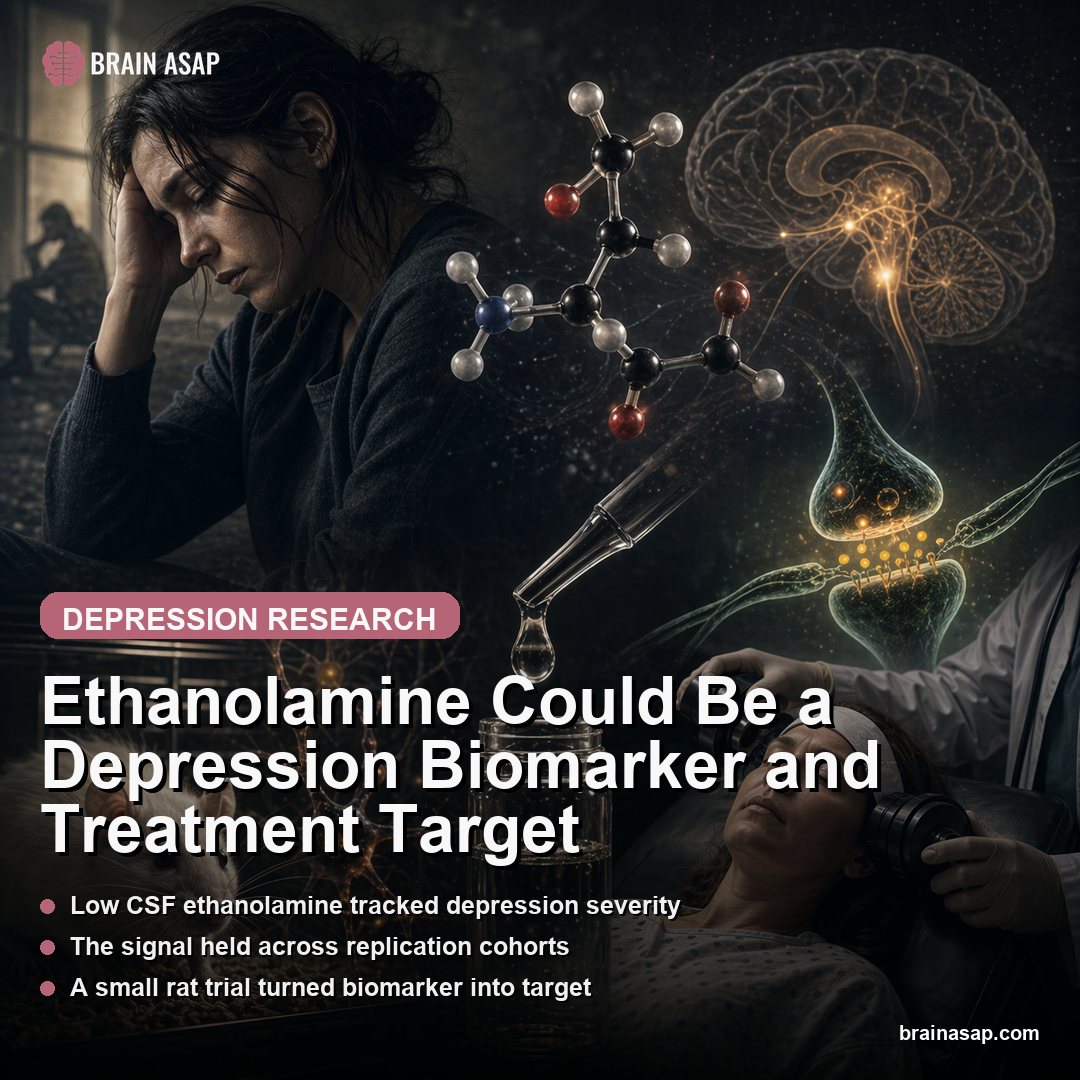
Ethanolamine Looked Like a Depression Biomarker and Treatment Target
TL;DR: In a 380-person cerebrospinal fluid dataset, patients with active major depression had lower ethanolamine levels than controls, those levels rose after electroconvulsive therapy, and parallel rat experiments suggested the molecule may be more than just a marker.
Key Findings
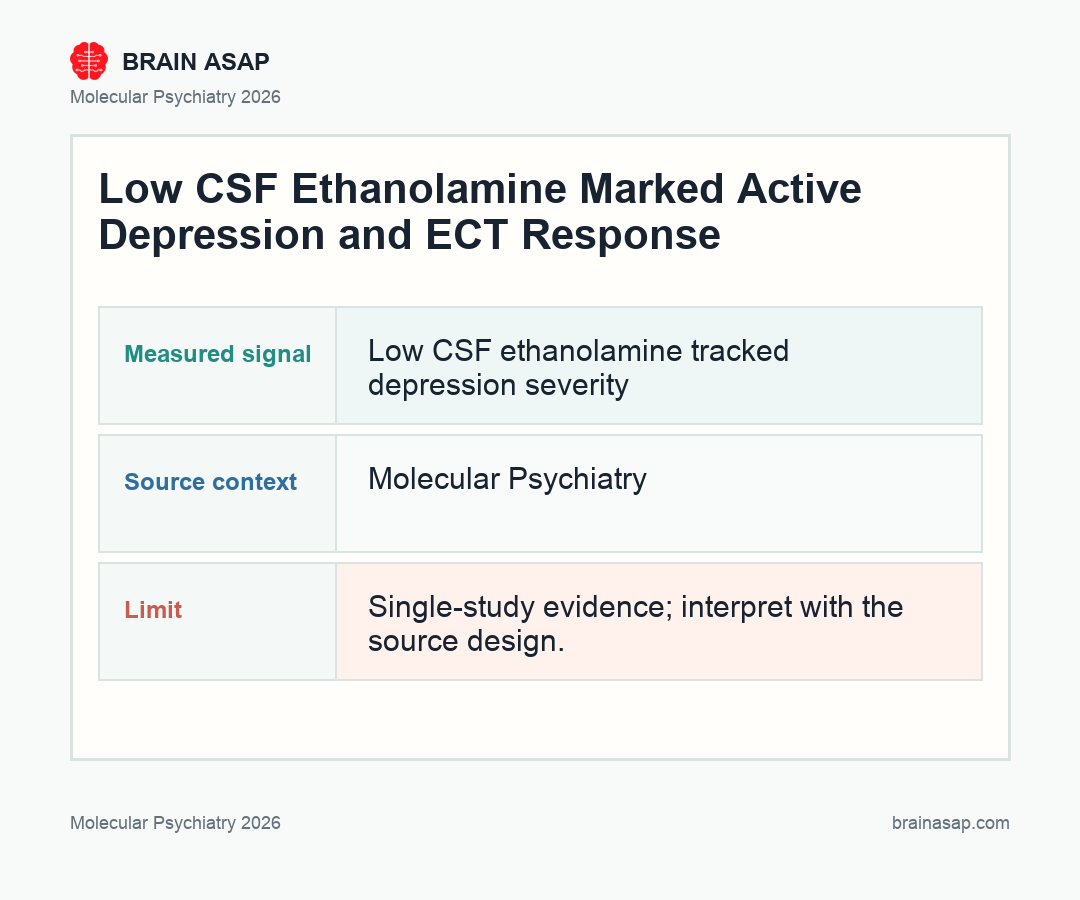
- 380-person cerebrospinal fluid (CSF), the fluid surrounding the brain and spinal cord cohort: In sample set A, active major depressive disorder was associated with lower cerebrospinal fluid ethanolamine than healthy controls (12.32 vs 14.07 μM, p = 0.00047, Cohen’s d = -0.59), while remitted MDD was not meaningfully different.
- Severity-linked drop, not just diagnosis: CSF ethanolamine fell as depression got worse, correlating with total HAM-D severity (ρ = -0.29, p = 0.00015) and showing especially large effects in moderate-to-severe depression regardless of medication status (d = -1.14 to -1.27).
- Dopamine signal stronger than serotonin: In medication-free subjects, ethanolamine correlated with the dopamine metabolite homovanillic acid (r = 0.40, p = 6.7E-8) more strongly than with the serotonin metabolite 5-HIAA (r = 0.26, p = 0.00064).
- ECT moved the biomarker upward: In 13 patients receiving electroconvulsive therapy, CSF ethanolamine rose from 10.51 to 11.85 μM after treatment (p = 0.0071, d = 0.90), with larger increases tracking better recovery on the HAM-D somatic-anxiety subscale.
- 4-site replication held up: In an independent multicenter sample, patients with MDD again showed lower ethanolamine than controls (12.22 vs 14.56 μM, p = 0.0037, d = -0.91), making this more than a single-lab curiosity.
- 40 protein links, CHL1 on top: Proteomics tied ethanolamine to 40 significant proteins, led by CHL1 (r = 0.42, p = 1.5E-9), with axon-guidance biology emerging as the most enriched pathway (p = 3.4E-20).
Source: Molecular Psychiatry (2026) | Ogawa et al.
Depression biomarker papers usually die in one of two ways: the signal vanishes in replication, or it never connects to anything biologically interesting enough to matter. This one is harder to dismiss. A small, basic metabolite called ethanolamine tracked depressive state in humans, moved with treatment, linked to dopamine-related chemistry, and pointed toward axon-guidance biology that sounds more like circuitry than lab trivia.
Why a 380-Person CSF Dataset Made Ethanolamine Hard to Ignore
Ethanolamine is not one of the celebrity molecules in psychiatry. It is a small metabolite and a building block for membrane lipids, not the kind of thing patients ask about by name. That is exactly why this paper is interesting: the signal did not come from a fashionable theory but from a molecule the field could easily have overlooked.
The core dataset was bigger than most cerebrospinal fluid psychiatry studies. Sample set A included 380 people spanning healthy controls, remitted MDD, active MDD, bipolar disorder, and schizophrenia. Once the authors adjusted for age, sex, and body mass index, the cleanest finding was in the clinically decisive group: people in an active depressive state had lower CSF ethanolamine than controls, whereas people with remitted MDD did not.
The distinction is important. A lot of psychiatric biomarkers merely separate diagnoses on paper.
This one looked more like a state marker than a trait marker. The paper’s strongest effect was not “depression ever” versus “no depression ever,” but depressed now versus remitted now.
The schizophrenia signal looked tempting at first, but it weakened after medication adjustment. That actually strengthens the depression signal. It suggests ethanolamine is not simply a general marker of “severe psychiatric illness,” and it shows the authors were willing to let a potentially exciting cross-diagnostic result shrink when the confound structure demanded it.
How Low Ethanolamine Tracked Depression Severity Better Than Diagnosis
The more revealing result was what ethanolamine did inside the depression group. Lower levels tracked worse HAM-D scores, with meaningful relationships not only for the total score but for subscales covering activity, sleep, psychic anxiety, and somatic anxiety. That pattern makes the molecule feel less like a paperwork biomarker and more like something tied to the lived texture of depression.
The medication-stratified analysis made the point sharper. In mild depression, the signal was more mixed.
But in moderate-to-severe depression, ethanolamine stayed low whether patients were medicated or not, with effect sizes between d = -1.14 and -1.27. Those are not decorative statistics. They imply the drop becomes most legible when illness burden is high enough to matter clinically.
Then there is the monoamine chemistry. Ethanolamine correlated strongly with homovanillic acid, the dopamine metabolite, and more modestly with 5-HIAA, the serotonin metabolite.
It did not correlate significantly with the noradrenaline metabolite MHPG. The monoamine pattern separated three signals:
- Dopamine: the strongest relationship was with homovanillic acid.
- Serotonin: the relationship with 5-HIAA was present but weaker.
- Noradrenaline: MHPG did not show a significant relationship.
If you had to summarize that pattern it would be this: ethanolamine sits closer to the dopamine side of depression biology than to a generic monoamine blur.
Dopamine-linked symptoms are often the hardest ones to shift: low motivation, reduced drive, psychomotor slowing, flattened reward. The paper does not prove ethanolamine causes those problems, but it places the biomarker near the neurotransmitter system most tightly tied to them.
ECT and a 4-Site Replication Make This Look State-Dependent
Replication is where biomarker claims usually become fragile. Here, the authors did two different kinds of replication.
First, they ran a new multicenter human sample collected outside the originating institution. Second, they tested whether the marker moved when a treatment moved the patient.
The multicenter replication was reassuringly direct. In sample set C, patients with MDD again showed lower CSF ethanolamine than healthy controls: 12.22 versus 14.56 μM, with Cohen’s d = -0.91.
That is not a tiny echo of the first result. It is the kind of independent confirmation that keeps a biomarker from being dismissed as site-specific noise.
The electroconvulsive therapy data were even more revealing conceptually, even though the sample was small. In 13 patients with MDD, ethanolamine rose significantly after ECT, from 10.51 to 11.85 μM. The increase did not cleanly track every HAM-D summary score, but it did line up with improvement in the somatic-anxiety subscale.
That is exactly the sort of imperfect but meaningful result you expect from a state-dependent biomarker. If ethanolamine were merely a background feature of who these patients are, it should not move this way after treatment. The fact that it did suggests the molecule is at least partly reflecting current illness biology rather than fixed vulnerability alone.
The authors make an additional speculative link here that is worth taking seriously, not because it is proven, but because it is plausible. Their group previously reported gray-matter volume increases after ECT in medial temporal and anterior cingulate regions. Since ethanolamine is a phospholipid-related molecule tied to membranes, synapses, and axons, they argue that rising CSF levels after ECT may fit with structural remodeling rather than symptom change in the abstract.
What a 7-Day LPS Rat Model and a 4-Week Oral EA Trial Added
The paper could have stopped at human biomarker validation and still been publishable. Instead, it took a riskier translational step: asking whether animal models of depression-like behavior also show reduced ethanolamine, and whether giving ethanolamine back changes behavior.
In the rat model, repeated lipopolysaccharide dosing for 7 days lowered CSF ethanolamine in a dose-dependent way, from 30.96 μM in controls to 27.62 μM at 0.5 mg/kg and 25.59 μM at 1.0 mg/kg. The higher-dose animals also spent less time in the open-field center, showed more forced-swim immobility, and had reduced sucrose preference, a package that the paper treats as anxiety-, depression-, and anhedonia-like behavior.
That is not the same as modeling human major depression in full. But it does show that when the animals look more depression-like on standard assays, ethanolamine falls in the same direction as it does in human MDD. For a translational biomarker, that is an important bridge.
The bolder experiment was the oral supplementation arm. Rats given ethanolamine in drinking water for 4 weeks did not suddenly become super-rats.
They showed no dramatic change in open-field or sucrose-preference measures. What moved was the forced-swim readout, where immobility dropped significantly with a large effect size (d = -1.36).
The result is intriguing and limited at the same time. The paper gives you just enough to believe ethanolamine might have an antidepressant-like behavioral effect, but nowhere near enough to treat it like a supplement recommendation. The authors themselves are cautious about safety, formulation, and whether any natural-source or derivative strategy could make this biologically usable.
CHL1 and Axon-Guidance Proteins Strengthened the Depression Link
What stops the paper from reading like “interesting metabolite, please replicate” is the proteomics. In a 191-person subset, the authors linked ethanolamine levels to 40 proteins that survived correction for multiple comparisons. The strongest hit was CHL1, a neural cell adhesion molecule involved in nervous system development and synaptic plasticity.
That is not an arbitrary association. CHL1 has already been discussed as a potential antidepressant-response marker in selective serotonin reuptake inhibitor research. Here it reappears in a different context, attached not to pill response alone but to a CSF metabolite that also tracks depressive state.
More importantly, the broader pathway interpretation converged on axon guidance. The enriched proteins touched neurite extension, projection morphogenesis, and related wiring biology. That shifts the interpretation of ethanolamine away from “circulating stress debris” and toward something more structural: membrane composition, neural connectivity, and the maintenance of signaling architecture.
That does not show low ethanolamine is causing depression by itself. But it does mean the biomarker is embedded in a biologically coherent network. When a paper links one molecule simultaneously to severity, treatment response, dopamine-related chemistry, and axon-guidance proteins, the argument stops being purely correlational in spirit, even if it is not yet causal in proof.
How a Lumbar-Puncture Biomarker Still Faces a Translation Problem
The obvious limitation is practical. CSF biomarkers are not easy outpatient tools.
Blood tests scale; lumbar punctures do not. So even if ethanolamine keeps replicating, the clinical future may depend on whether it can be translated into a blood proxy, an imaging correlate, or a biologically linked panel that avoids spinal taps.
There are also scientific limits that matter. The ECT sample was only 13 people.
The human cohorts were all Japanese, which is a reasonable starting point but not a final answer. And the animal evidence relies heavily on assays like the forced-swim test, which remain useful for screening while also being controversial as stand-ins for human depression.
Then there is the temptation readers should resist: turning this into a self-experiment interpretation. The rat data are interesting, but they are nowhere near enough to justify treating ethanolamine as an off-the-shelf mood compound. The paper itself frames oral EA as a lead worth developing, not a consumer-ready intervention.
Still, the overall picture is unusually strong for psychiatry biomarker research. This was not one small cohort, one nominal p-value, and a hand-waving mechanism paragraph.
It was a layered argument: active depression lowers CSF ethanolamine, treatment raises it, dopamine-related chemistry tracks with it, animal models reproduce it, and axon-guidance biology surrounds it. That is enough to take the molecule seriously, even if it is too early to call it clinically ready.
Paper: Ethanolamine as a potential biomarker and therapeutic target for depressive disorder. Molecular Psychiatry. 2026.. DOI: 10.1038/s41380-026-03559-7
Authors: Ogawa et al.
Study Design: Cohort study
Sample Size: ECT moved the biomarker upward: In 13 patients receiving electroconvulsive therapy, CSF ethanolamine rose from 10.51 to 11.85 μM after treatment (p = 0.0071, d = 0.90), with larger increases tracking better recovery on the HAM-D somatic-anxiety subscale.
Key Statistic: 380-person CSF cohort: In sample set A, active major depressive disorder was associated with lower cerebrospinal fluid ethanolamine than healthy controls (12.32 vs 14.07 μM, p = 0.00047, Cohen’s d = -0.59), while remitted MDD was not meaningfully different.