TL;DR: A 2026 study in Nature Communications used resting-state functional MRI (fMRI) to link major depressive disorder to more frequent but shorter visits to a salience-dominated brain state.
Key Findings
- Resting-state fMRI compared depression with controls: the analysis included 38 adults with major depressive disorder and 38 healthy controls.
- Structural-connectivity modeling used a smaller subset: diffusion-imaging models included 26 depression participants and 27 controls.
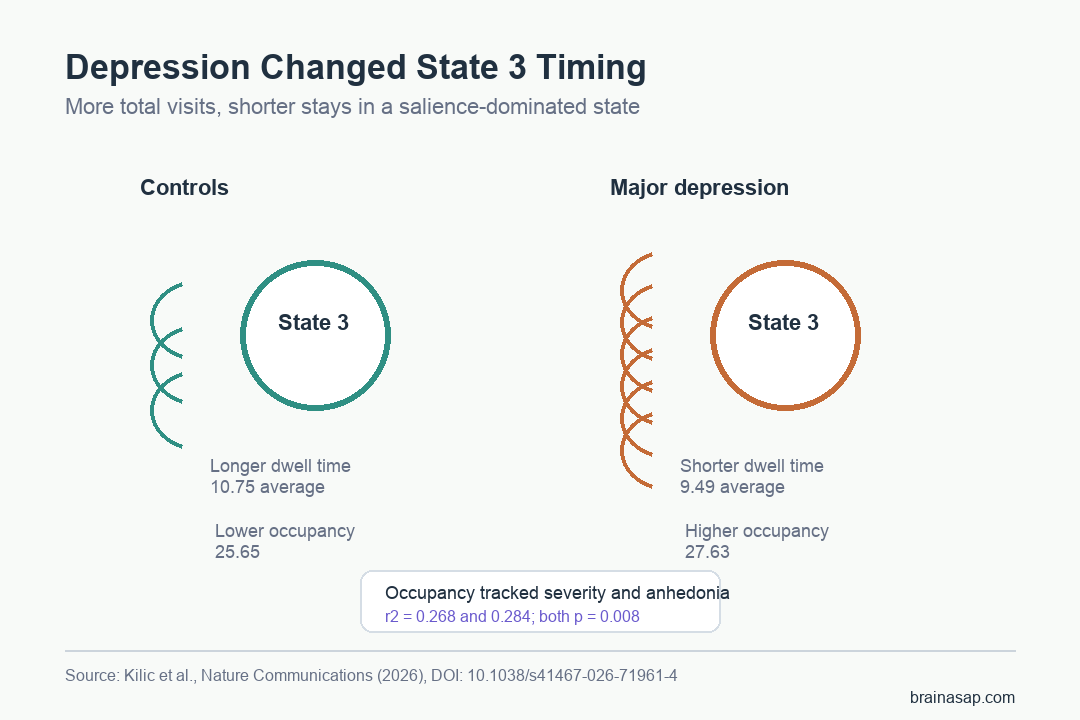
- State 3 was less stable in depression: controls stayed in this salience-dominated state longer than depression participants (10.75 vs 9.49; FDR-adjusted p = 0.005).
- State 3 was visited more often in depression: fractional occupancy was higher in the depression group (27.63 vs 25.65; FDR-adjusted p = 0.035).
- Symptoms tracked transition behavior: in depression, State 3 fractional occupancy correlated with depression severity (r2 = 0.268; p = 0.008) and anhedonia (r2 = 0.284; p = 0.008).
Source: Nature Communications (2026) | Kilic et al.
Major depressive disorder is often studied by comparing static brain connectivity between groups. The researchers asked a more dynamic question: how does the resting brain move between recurring whole-brain activity states?
Researchers combined resting-state functional MRI with diffusion-weighted structural connectivity. The functional scans identified recurring coactivation patterns, while the structural scans helped estimate how easy or costly it should be for the brain to move from one state to another.
Resting-State fMRI Identified Four Recurring Brain States
The analysis clustered moment-to-moment fMRI activity into 4 recurring whole-brain states. These states were not single regions lighting up; they were broad patterns involving canonical networks such as visual, attention, limbic, default-mode, salience, and frontoparietal systems.
The depression-group result centered on State 3. This state involved higher coactivation of ventral attention, subcortical, and somatomotor systems, with lower-amplitude coactivation of default-mode and frontoparietal networks.
- Resting-state fMRI: measured spontaneous blood-oxygen-level activity while participants were not doing a task.
- Diffusion-weighted imaging: estimated white-matter structural connections between brain regions.
- Network control modeling: estimated how structural wiring could constrain transitions between activity states.
That combination let the authors look beyond whether a network was stronger or weaker on average. The key question became whether depressed brains moved through the state space differently.
Depression Participants Entered and Exited State 3 More Often
State 3 had an unusual pattern. Adults with depression spent a slightly larger share of the scan in that state, but each visit tended to be shorter.
Controls had longer dwell time in State 3, averaging 10.75 compared with 9.49 in the depression group. The group difference survived false-discovery-rate correction with p = 0.005.
At the same time, depression participants had higher fractional occupancy in State 3: 27.63 versus 25.65 in controls, with FDR-adjusted p = 0.035.
This timing profile is why the analysis focuses on transitions. A brain state can become more common because it is stable, or because the system keeps returning to it after brief exits.
Here, the second explanation fit the data better.
Anhedonia and Depression Severity Tracked State 3 Dynamics
State 3 was clinically relevant because its dynamics tracked symptom dimensions. In depression participants, higher State 3 fractional occupancy correlated with broader depression severity and with anhedonia, or reduced ability to experience pleasure.
The reported associations were r2 = 0.268 for depression severity and r2 = 0.284 for anhedonia, both with FDR-adjusted p = 0.008.
- Higher fractional occupancy: more total scan time assigned to State 3.
- Shorter dwell time: each visit to State 3 lasted for less time on average.
- More transitions: the state was entered and exited more often in the depression group.
Dwell time showed a different symptom pattern. Longer State 3 dwell time was inversely related to anhedonia in both controls and depression participants, meaning more stable time in that state went with lower anhedonia scores.
Structural Wiring Suggested a Costly Transition Pattern
The diffusion-imaging part gave the study its energy-landscape framing. Using structural connectivity, researchers estimated how much external input would be needed to move between brain states.
Depression severity was linked to reduced transitions between visual-attentional and limbic-default-mode configurations. The authors interpreted that as a possible marker of cognitive rigidity, because the system preferred some harder transitions even when the structural network offered easier alternatives.
- Functional state: the activity pattern observed in the fMRI time series.
- Structural path: the white-matter connectivity pattern that should make some transitions easier than others.
- Energetic asymmetry: one direction of a state transition may be easier than the reverse direction.
The scan is not a diagnostic test for depression. The study instead found a measurable relationship between symptom burden and the way whole-brain activity moved through structurally constrained state transitions.
Dynamic Brain-State Biomarkers Are Not a Clinical Test Yet
The strength of the analysis is that it links symptoms, functional dynamics, and structural wiring in the same framework. It treats depression as a disorder of changing brain-state trajectories, not only as a static connectivity difference.
The limits are equally important. The sample included 38 depression participants, and only 26 had the diffusion imaging used for structural-control modeling. The findings need replication before they can guide diagnosis or treatment selection.
Several cautions shape the interpretation:
- Resting-state design: the scans did not test task performance, emotion regulation, or treatment response.
- Modest sample size: the structural-connectivity subset was smaller than the fMRI sample.
- Model dependence: state definitions and energy estimates depend on clustering and network-control assumptions.
- Clinical heterogeneity: depression symptoms vary widely, so one state-transition pattern is unlikely to cover every patient.
Practical takeaway: the imaging result supports a dynamic view of depression, where symptom severity may relate to repeated movement into and out of particular brain states. It is a mechanistic imaging result, not a stand-alone biomarker.
Citation: DOI: 10.1038/s41467-026-71961-4. Kilic et al. Spatiotemporal asymmetries on brain energy landscape uncover system entrapment related to depression severity. Nature Communications. 2026.
Study Design: Resting-state fMRI and diffusion-weighted imaging study comparing adults with major depressive disorder and healthy controls.
Sample Size: 76 participants had resting-state fMRI; 53 of them also had diffusion-weighted imaging for structural-connectivity modeling.
Key Statistic: Depression participants had shorter State 3 dwell time but higher State 3 fractional occupancy, and occupancy correlated with depression severity and anhedonia in the depression group.
Caveat: The imaging findings are mechanistic and model-based, with a modest structural-imaging subset and no diagnostic validation.