TL;DR: A 2026 Molecular Psychiatry ENIGMA mega-analysis found that medication status in bipolar disorder was linked to subtle differences in subcortical brain volume, with antiepileptic and antipsychotic exposure most consistently tied to smaller hippocampal and thalamic volumes.
Key Findings
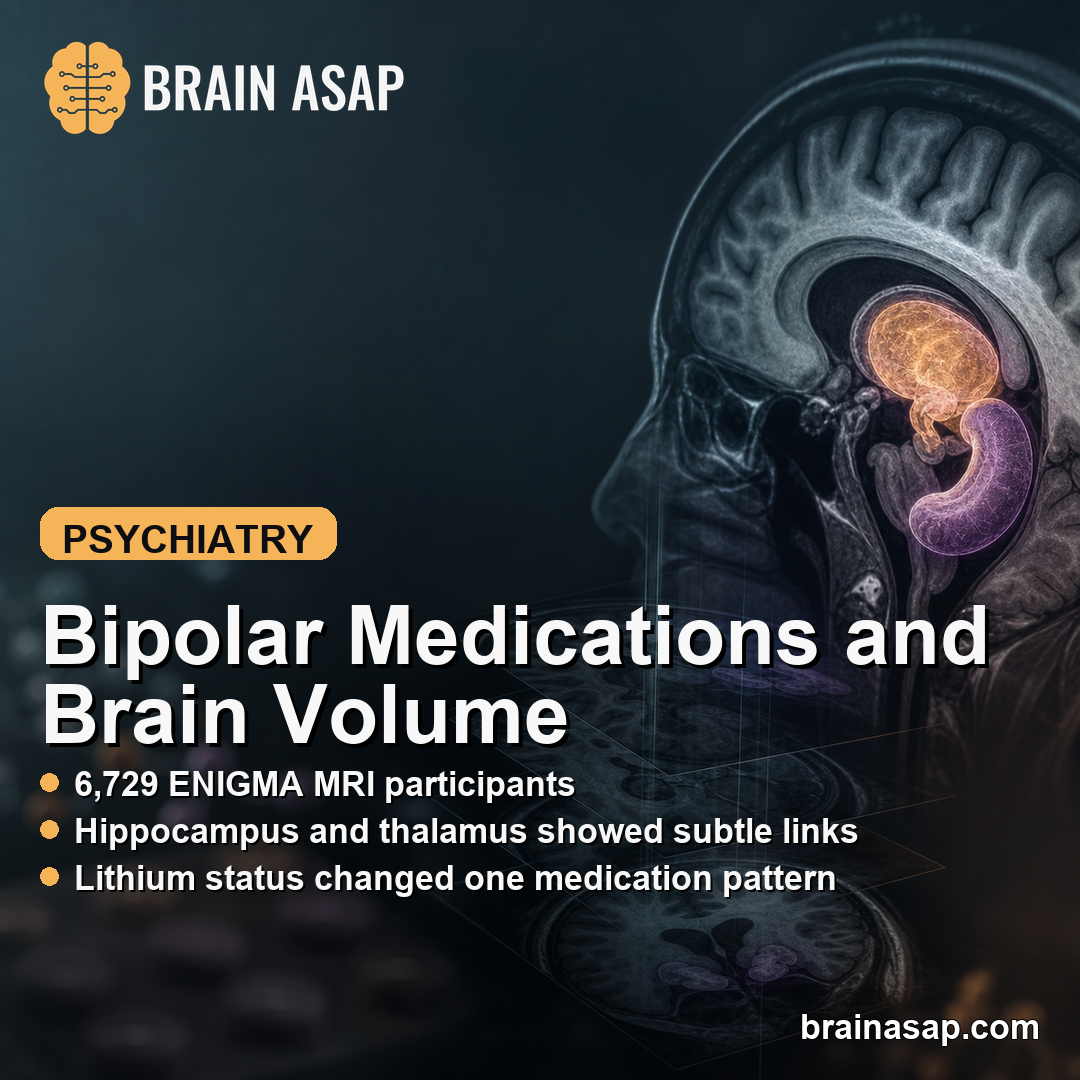
- 6,729-person ENIGMA sample: Researchers pooled MRI data from 2,664 people with bipolar disorder and 4,065 controls across 34 research groups.
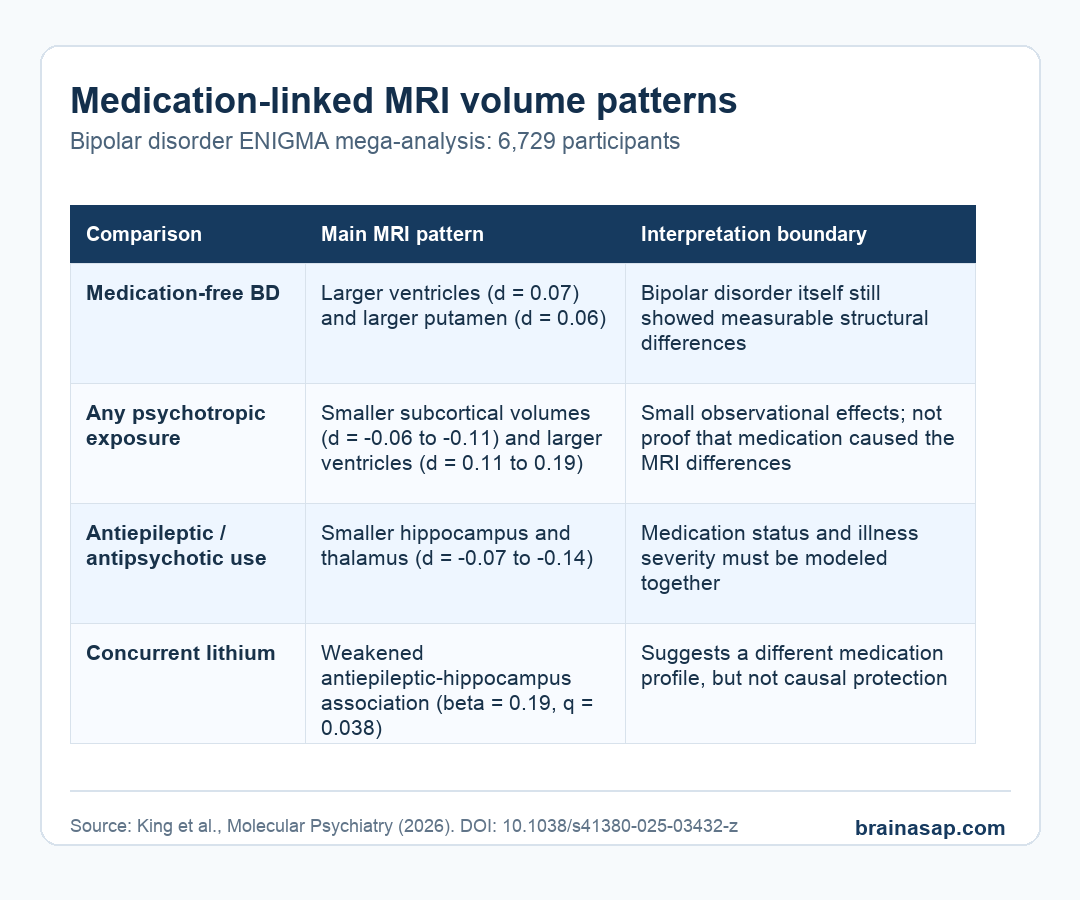
- Medication-free comparison: The 410 medication-free bipolar patients showed mild ventricular enlargement (d = 0.07) and increased putamen volume (d = 0.06) compared with controls.
- Medicated-group pattern: Patients taking psychotropic medications showed smaller subcortical volumes (d = -0.06 to -0.11) and larger ventricles (d = 0.11 to 0.19).
- Antiepileptic and antipsychotic association: Use of antiepileptic and antipsychotic medications was associated with smaller hippocampal and thalamic volumes (d = -0.07 to -0.14).
- Mechanism categories and lithium mattered: The Neuroscience-based Nomenclature analysis pointed especially to valproate and dopamine plus other monoamine receptor antagonists, while concurrent lithium weakened the antiepileptic-hippocampal association.
Source: Molecular Psychiatry (2026) | King et al.
Bipolar disorder imaging studies often report smaller hippocampal or thalamic volumes and larger ventricles. Those results are hard to interpret when many patients are taking several medications at once.
This study asked a narrower question: how much of the brain-volume pattern changes when medication status is modeled directly?
No single drug explained the whole pattern. The associations were small, observational, and entangled with illness severity, but they were consistent enough to show why medication exposure cannot be treated as background noise in bipolar neuroimaging.
ENIGMA Pooled Bipolar MRI Data Across 34 Research Groups
The analysis used the ENIGMA Bipolar Disorder Working Group, which applies standardized MRI processing across international datasets. Researchers measured bilateral volumes for the lateral ventricles, nucleus accumbens, amygdala, hippocampus, pallidum, putamen, caudate, and thalamus.
The large pooled sample helps because medication-brain studies are easily underpowered. Here, the team could compare healthy controls with bipolar patients taking no medication, one medication class, two medication classes, or three or more classes at the time of MRI.
- Controls: 4,065 people without bipolar disorder formed the reference group.
- Bipolar disorder: 2,664 patients contributed MRI data, with medication status available for most of them.
- Medication classes: The main syndrome-based categories were lithium, antiepileptics, antipsychotics, and antidepressants.
- Brain regions: The study focused on subcortical regions that repeatedly appear in bipolar imaging work.
The study also used Neuroscience-based Nomenclature, or NbN, which groups psychiatric drugs by mechanism rather than clinical label. That helped separate, for example, valproate from other antiepileptic drugs instead of treating all antiepileptics as one biological category.
Medication-Free Patients Showed a Different Pattern Than Medicated Patients
The medication-free group did not look identical to controls. Patients with bipolar disorder who were not taking psychotropic medications at the time of MRI had mildly larger ventricles and larger putamen volume, while intracranial volume was smaller.
The medicated groups showed a broader structural pattern. Compared with controls, patients taking one, two, or three medication classes had smaller hippocampal and thalamic volumes and larger ventricles.
The two-medication group showed the largest effect sizes in several comparisons, and it also showed smaller amygdala volume.
- No medication: The strongest reported differences were mild ventricular enlargement and increased putamen volume.
- One or more medication classes: Smaller hippocampus and thalamus appeared more consistently.
- Two or more medications: Propensity-matched analyses still showed lower thalamic and hippocampal volumes and larger ventricular volume.
That does not prove medication caused the differences. Patients who need multiple medications may also have more severe, longer, or treatment-resistant illness.
A narrower interpretation is safer: medication exposure and illness course are both part of the MRI pattern and need to be modeled together.
Antiepileptic and Antipsychotic Exposure Carried the Clearest Volume Associations
When researchers compared medication classes, antiepileptic and antipsychotic exposure stood out. Antiepileptic use was associated with smaller hippocampus, smaller thalamus, smaller putamen, and larger ventricles after accounting for age, sex, intracranial volume, site, and other medication classes.
Antipsychotic use was also linked to smaller hippocampal and thalamic volumes and larger ventricles, along with larger caudate volume in some comparisons. Antidepressant exposure had a narrower pattern, mainly smaller hippocampal volume.
- Antiepileptics: The paper reported hippocampus, thalamus, putamen, and ventricle associations.
- Antipsychotics: The clearest findings involved hippocampus, thalamus, ventricles, and caudate measures.
- Antidepressants: The main syndrome-based association was smaller hippocampal volume.
- Lithium: Lithium users had larger thalamic and hippocampal volumes than nonusers in direct patient comparisons.
Mechanism-Based Drug Categories Clarified the Signal
The NbN analysis sharpened the broad medication labels. Among antiepileptic medications, valproate showed a widespread pattern involving smaller hippocampus, thalamus, and putamen volumes plus larger ventricles.
Other antiepileptic mechanisms, such as glutamate or sodium/calcium channel blockers including lamotrigine, did not show the same significant subcortical differences compared with controls.
Antipsychotic mechanism also differed by category. Drugs categorized as dopamine and other monoamine receptor antagonists were linked to smaller hippocampal volume and larger ventricles.
Dopamine-serotonin partial agonists and antagonists showed larger globus pallidus, caudate, and putamen volumes.
- Valproate pattern: Smaller hippocampus, thalamus, and putamen plus larger ventricles drove much of the antiepileptic pattern.
- Lamotrigine-like group: Sodium/calcium channel blockers did not show significant subcortical volume differences versus controls in this analysis.
- Monoamine antagonists: This antipsychotic mechanism category was linked to smaller hippocampal volume and larger ventricles.
That distinction is clinically important because “antiepileptic” and “antipsychotic” are treatment labels, not precise brain mechanisms. A medication class can contain drugs with different targets, different clinical uses, and different confounding by severity.
Lithium Looked Different, But the Study Cannot Prove Protection
Lithium had a different profile from several other medication classes. Patients taking lithium had larger thalamic and hippocampal volumes than patients not taking lithium, and concurrent lithium use weakened the negative association between antiepileptic exposure and hippocampal volume.
That interaction fits prior work suggesting lithium may have neurotrophic or neuroprotective associations, but the paper stayed cautious. The analysis was observational, and lithium users may differ from nonusers in illness subtype, prescribing history, treatment response, or clinical monitoring.
The most defensible interpretation is that lithium status should be included carefully in bipolar MRI studies rather than collapsed into a generic “medicated” variable. This is a modeling lesson before it is a treatment claim.
The Main Caveat Is Indication Bias
The authors repeatedly emphasized that these are associations, not proof that medication exposure caused smaller brain volumes. People taking several psychotropic medications often have more severe illness, more hospitalizations, longer illness duration, or harder-to-treat bipolar disorder.
The study tried to address this with propensity score matching in a subset with detailed clinical information. Even there, polypharmacy was associated with lower thalamic and hippocampal volumes and larger ventricles.
Residual confounding remains a serious limitation.
- Observational design: The MRI scans and medication status cannot establish cause and effect.
- Clinical severity: More severe bipolar illness can lead to both medication complexity and brain-volume differences.
- Medication timing: Current medication at scan does not capture lifetime dose, duration, adherence, or past switches.
- Effect size: Most detected effects were subtle, usually below d = 0.2.
No medication should be feared or favored based on MRI volume alone. Bipolar brain-imaging studies need to treat medication exposure as a central variable, especially when interpreting hippocampal, thalamic, putamen, and ventricular findings.
Citation: DOI: 10.1038/s41380-025-03432-z. King et al. Psychotropic medications and their interactions with subcortical brain volume in bipolar disorder: An ENIGMA mega-analysis. Molecular Psychiatry. 2026;31:2941-2953.
Study Design: International ENIGMA mega-analysis of structural MRI data with medication-status modeling.
Sample Size: 2,664 people with bipolar disorder and 4,065 controls from 34 research groups.
Key Statistic: Medicated patients showed smaller subcortical volumes (d = -0.06 to -0.11) and larger ventricles (d = 0.11 to 0.19), with antiepileptic and antipsychotic exposure tied to smaller hippocampal and thalamic volumes.
Caveat: Observational medication status cannot separate drug effects from illness severity, treatment resistance, or lifetime exposure history.