TL;DR: A 2026 study in Cognitive, Affective, & Behavioral Neuroscience used task-based functional MRI (fMRI), a brain-scan method that tracks blood-oxygen changes during a task, to show that misophonia and hyperacusis had partly different brain connectivity patterns during unpleasant sound processing.
Key Findings
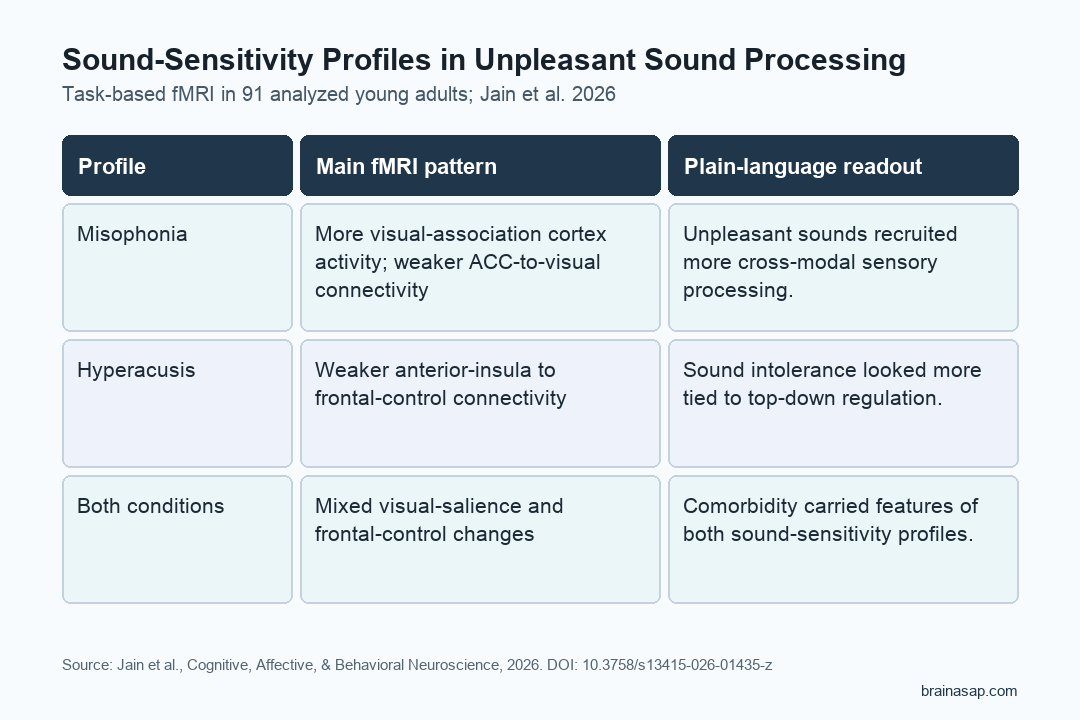
- 91 young adults were analyzed after 1 participant was excluded for excessive motion during fMRI.
- Misophonia, a strong emotional reaction to specific trigger sounds, was linked to greater visual-association cortex activation during unpleasant sounds.
- Hyperacusis, loudness-related sound intolerance, showed weaker connectivity between salience hubs and frontal control regions.
- Comorbid participants showed a mix of the misophonia-linked and hyperacusis-linked patterns.
- Standardized affective sounds were used instead of personal trigger sounds, so the results map general unpleasant-sound processing rather than each person’s worst triggers.
Source: Jain et al. studied sound-sensitivity profiles using task-based fMRI while participants rated unpleasant, neutral, and pleasant sounds.
Misophonia and Hyperacusis Are Not the Same Sound Problem
Misophonia and hyperacusis can both make ordinary sound hard to tolerate, but the trigger logic differs. Misophonia usually involves a sharp emotional reaction to specific repeated or body-related sounds, such as chewing, sniffing, or pen clicking.
Hyperacusis is more tied to loudness: sound becomes uncomfortable or painful when it crosses a person’s tolerance threshold.
The distinction is practical because the 2 conditions often overlap. A person can meet criteria for one, the other, or both, and symptom checklists alone can blur the mechanisms.
The researchers separated participants into 4 groups so the fMRI results could be read profile by profile:
- Misophonia only: 29 participants had misophonia without meeting the study’s hyperacusis cutoff.
- Hyperacusis only: 14 participants met the hyperacusis cutoff without misophonia.
- Comorbid group: 24 participants had both misophonia and hyperacusis.
- Controls: 25 participants had neither sound-sensitivity condition.
The groups were similar in age, sex distribution, pure-tone hearing thresholds, major-depression ratings, and obsessive-compulsive-disorder ratings. Hyperacusis status was supported by lower loudness discomfort levels in the hyperacusis and comorbid groups.
Participants Rated 90 Affective Sounds During fMRI
During scanning, participants heard 90 affective sounds drawn from the International Affective Digitized Sounds-2 database. The sound set was designed to include unpleasant, neutral, and pleasant material, and participants rated each sound as pleasant, neutral, or unpleasant while lying in the scanner.
The researchers then modeled brain activity using each person’s own ratings, not only the database labels. This choice is important for sound-sensitivity research because the same sound can feel neutral to one participant and aversive to another.
The task did not use common misophonia trigger sounds as the main stimulus class. The design is cleaner for comparing groups, but it also narrows the interpretation.
The finding covers general unpleasant sound processing, not a direct test of chewing, breathing, or other personal trigger sounds.
Misophonia Showed More Visual-Cortex Involvement
The clearest activation result involved the visual system. For unpleasant versus neutral sounds, the full-group analysis found a significant cluster in the left visual association cortex that extended into secondary visual areas.
Group comparisons sharpened the pattern. The comorbid group showed significantly greater activation than controls in the left visual association area, and the misophonia-only group showed a similar but weaker effect.
The hyperacusis-only group did not show the same activation difference.
Connectivity results pointed in the same direction. Both misophonia groups showed reduced connectivity between the anterior cingulate cortex (ACC), a salience and control-related region, and the left superior lateral occipital cortex/angular gyrus region during unpleasant sounds.
- Activation result: Misophonia-linked groups showed stronger visual-association cortex responses to unpleasant sounds.
- Connectivity result: ACC-to-visual-region connectivity was weaker in misophonia-linked groups than in controls.
- Interpretation: Unpleasant sounds in misophonia may recruit cross-modal sensory systems, not only auditory cortex.
The finding should not be read as evidence that misophonia is a visual disorder. It suggests that unpleasant sound processing in misophonia may pull in brain systems that support sensory prediction, imagery, attention, or contextual processing.
Hyperacusis Showed Weaker Salience-to-Control Connectivity
Hyperacusis had a different strongest pattern. The hyperacusis-only group showed reduced connectivity between the left anterior insula, a salience-network hub, and the left medial superior frontal gyrus, a frontal control region.
The reduction was strongest when hyperacusis was compared with misophonia.
Additional central-executive-network results also separated the groups. The hyperacusis-only group showed lower connectivity between the left dorsolateral prefrontal cortex and left cerebellar Crus I compared with the misophonia-only group.
Both misophonia-only and hyperacusis-only groups showed greater dlPFC-to-supplementary-motor-area connectivity than controls.
Taken together, the hyperacusis findings point toward altered top-down regulation and sensory-motor control during aversive sound processing. That fits the clinical picture of hyperacusis as a sound-tolerance condition where loudness and discomfort thresholds matter.
The Comorbid Group Carried Both Patterns
The comorbid group was not just an average of the other two groups. Participants with both conditions showed the misophonia-linked visual pattern and parts of the hyperacusis-linked frontal-control pattern.
- Misophonia-like feature: greater visual-association cortex activation and weaker ACC-to-visual-region connectivity.
- Hyperacusis-like feature: reduced connectivity between salience and prefrontal control regions.
- Behavioral feature: the comorbid group rated more sounds as unpleasant, including sounds that were predefined as neutral or pleasant.
That combination supports a practical point: people with both misophonia and hyperacusis may need assessment that asks about trigger context and loudness tolerance separately. A single “sound sensitivity” score may hide clinically useful differences.
The fMRI Pattern Is Mechanistic, Not Diagnostic Yet
The study is useful because it directly compared misophonia, hyperacusis, comorbidity, and controls in the same fMRI task. The analysis also used permutation testing and corrected cluster-level thresholds for the whole-brain results.
The limitations are still important. The hyperacusis-only group had 14 participants, smaller than the target of at least 20 per group.
The sample was made up of young adults with mostly normal hearing. Personal misophonia trigger sounds were intentionally excluded, so the task may understate responses that appear during real-world trigger exposure.
Clinical takeaway: misophonia and hyperacusis may overlap at the symptom level while differing in brain-network emphasis. Misophonia leaned toward visual-salience coupling during unpleasant sounds.
Hyperacusis leaned toward salience-to-frontal-control connectivity changes. Future treatment research will need to test whether those patterns predict which patients respond to sound therapy, cognitive-behavioral approaches, exposure work, or combined care.
Citation: DOI: 10.3758/s13415-026-01435-z. Jain et al. Differential brain responses to affective sounds in misophonia and hyperacusis: A task-based fMRI approach. Cognitive, Affective, & Behavioral Neuroscience. 2026.
Study Design: Task-based fMRI study comparing misophonia, hyperacusis, comorbid misophonia/hyperacusis, and control groups during affective sound ratings.
Sample Size: 91 analyzed young adults after 1 motion-related exclusion; original group counts were 29 misophonia-only, 14 hyperacusis-only, 24 comorbid, and 25 controls.
Key Statistic: The unpleasant-versus-neutral whole-brain analysis found a visual-association cluster at peak MNI -20, -90, 28 with cluster-level FWE-corrected p = 0.0038.
Caveat: The task used standardized affective sounds rather than each participant’s personal trigger sounds, and the hyperacusis-only group was relatively small.