TL;DR: A 2026 Molecular Psychiatry study tested Regional Vulnerability Index for Alzheimer’s disease (RVI-AD), a structural-MRI score of how closely a person’s brain pattern resembles amyloid-positive Alzheimer’s disease, and found that higher RVI-AD predicted conversion from mild cognitive impairment to dementia most strongly in the first 3 years.
Key Findings
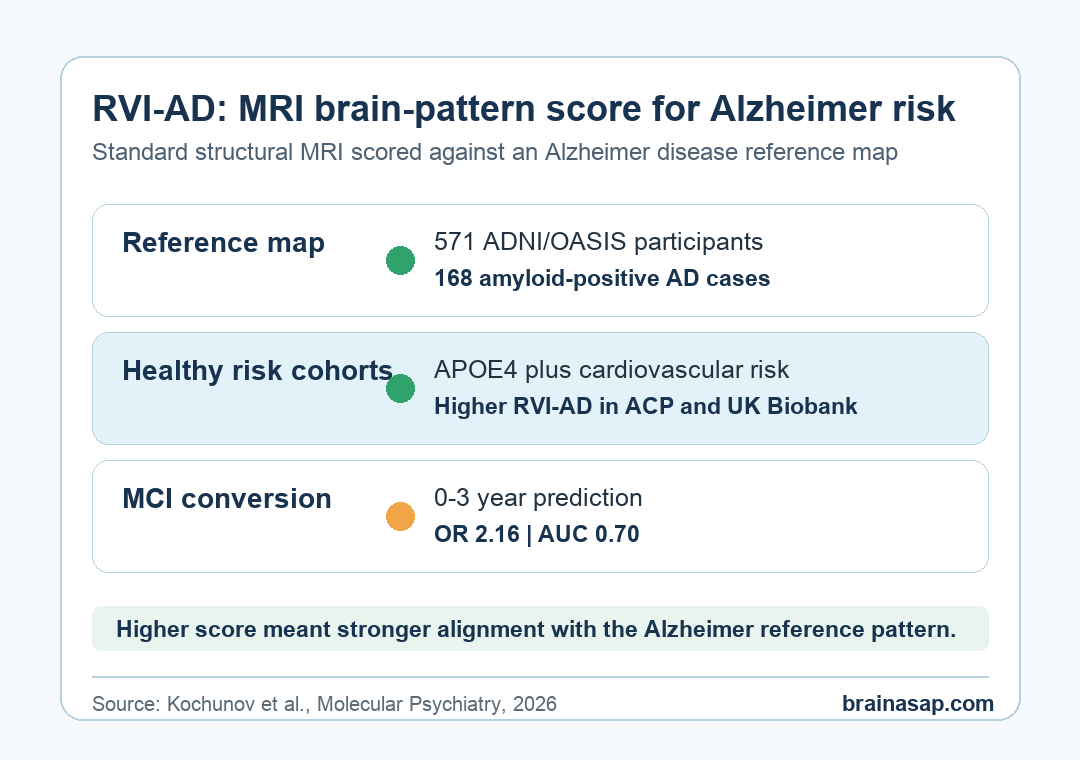
- 571-person reference map: Researchers built the RVI-AD pattern from amyloid-positive Alzheimer’s cases and amyloid-negative controls in ADNI and OASIS.
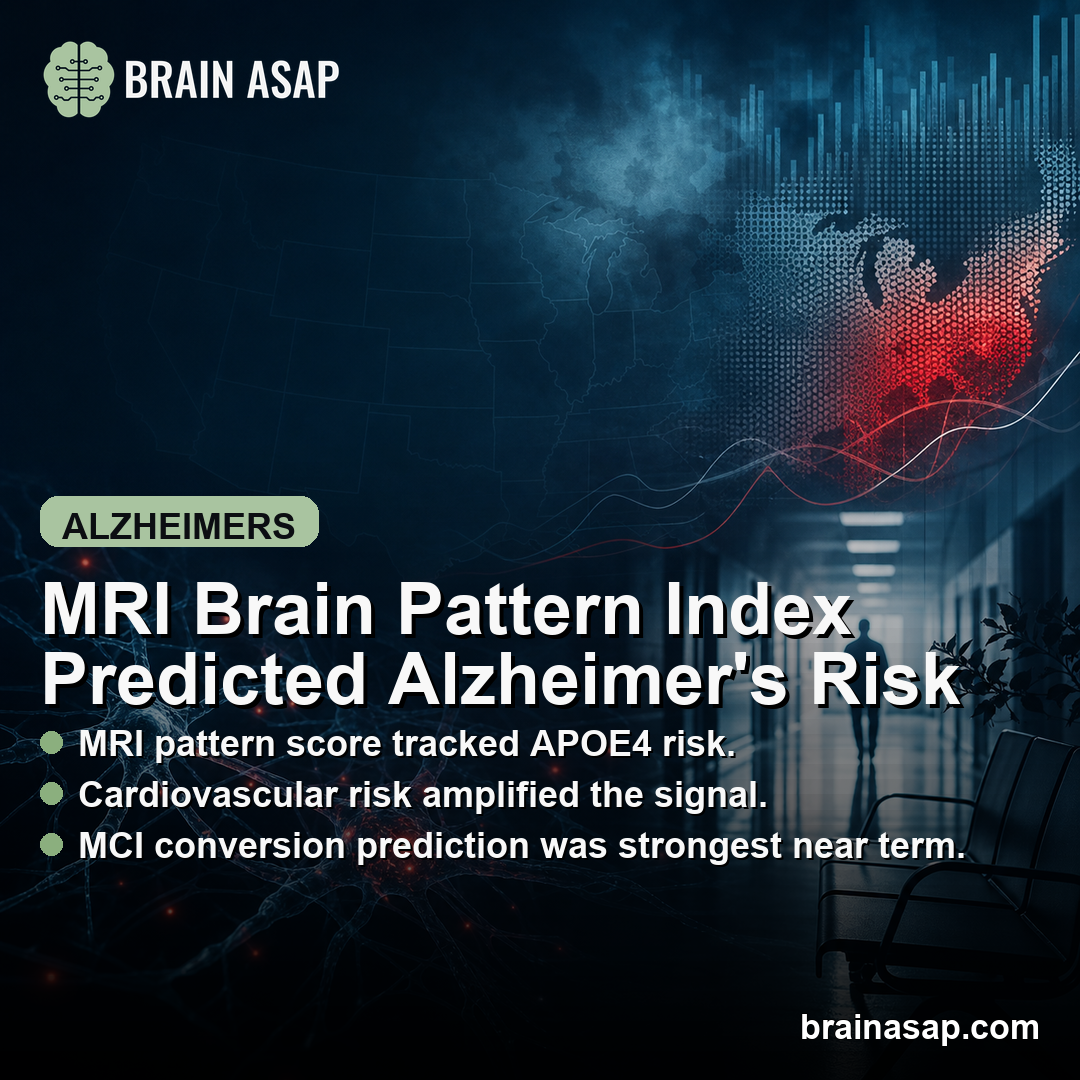
- Healthy-risk signal: APOE4 carriers had higher RVI-AD in the Amish Connectome Project and UK Biobank cohorts, even when single regions such as hippocampal volume were weaker markers.
- Cardiovascular interaction: Framingham cardiovascular risk tracked higher RVI-AD mainly among APOE4 carriers, with replication in both healthy cohorts.
- MCI conversion result: In ADNI, higher baseline RVI-AD predicted mild cognitive impairment (MCI) conversion to dementia, especially over the first 3 years.
- Short-term accuracy: For 0-3 year conversion, RVI-AD reached an AUC of 0.70, with an odds ratio of 2.16 and p < 2 x 10^-16.
Source: Molecular Psychiatry (2026) | Kochunov et al.
Regional Vulnerability Index for Alzheimer’s disease (RVI-AD) treats routine MRI as a pattern-matching tool. Instead of asking how one memory score or one brain region changed, the index asks whether many MRI features move together in the same direction as an Alzheimer’s reference map.
The measurement logic is practical. A single brain region can be noisy, and hippocampal shrinkage is not specific to Alzheimer’s disease.
RVI-AD instead uses a broader pattern across cortical thickness, subcortical volume, and white-matter measurements.
RVI-AD Turned Standard MRI Into a Brain-Pattern Score
Researchers first built the Alzheimer’s reference pattern from 571 people in ADNI and OASIS. That reference sample included 168 amyloid-positive Alzheimer’s cases and 403 amyloid-negative controls.
The team calculated regional effect sizes across 64 brain measures, including cortical, subcortical, and white-matter features. RVI-AD then scored each person by how strongly their own regional brain pattern aligned with that Alzheimer’s reference map.
- Positive RVI-AD: the person’s structural pattern is more aligned with the Alzheimer’s disease reference pattern.
- Lower or negative RVI-AD: the person’s structural pattern is less aligned with that reference pattern.
- Main advantage: the score uses ordinary structural MRI measurements instead of requiring a new invasive test.
That does not make RVI-AD a ready clinical screen. It makes the index a testable MRI biomarker candidate: a way to ask whether Alzheimer’s risk is already leaving a distributed structural fingerprint before dementia is diagnosed.
APOE4 and Cardiovascular Risk Left a Detectable MRI Pattern
The first risk test asked whether RVI-AD could detect known Alzheimer’s risk factors in people who were not already diagnosed with dementia. Researchers tested this in 335 Amish Connectome Project participants and then in 26,010 UK Biobank participants.
APOE4 carriers had higher RVI-AD in both groups. In the Amish cohort, the APOE4 difference reached p = 0.03. In the UK Biobank cohort, the replicated difference reached p = 2 x 10^-5.
The important comparison was not only APOE4 versus non-APOE4. Individual regional measurements, including hippocampal volume and cortical thickness in Alzheimer’s-affected regions, were weaker and less consistent than the whole-brain RVI-AD pattern.
- Genetic risk: APOE4 status was associated with a more Alzheimer’s-like structural MRI pattern.
- Cardiovascular risk: Framingham Cardiovascular Risk Score also contributed to higher RVI-AD.
- Combined risk: cardiovascular risk tracked RVI-AD most clearly among APOE4 carriers, suggesting that vascular risk may hit the brain differently when genetic susceptibility is present.
The healthy-cohort result matters for risk detection. RVI-AD separated more than diagnosed dementia from controls; it also captured subtle risk-linked brain patterns before a clinical Alzheimer’s diagnosis.
Higher RVI-AD Predicted MCI Conversion to Dementia
The conversion test asked whether the MRI pattern score predicted dementia after mild cognitive impairment was already present. Researchers used 1,932 ADNI participants, including 965 people with MCI at baseline.
Among those MCI participants, 335 converted to dementia over follow-up. People who converted had higher baseline RVI-AD than people who stayed at MCI, with the group difference reported at p = 3 x 10^-16.
Prediction was strongest soon after the MRI scan. For 0-3 year conversion, RVI-AD had an odds ratio of 2.16, AUC of 0.70, sensitivity of 0.62, and specificity of 0.70.
Researchers also reported a negative predictive value of 83.8%, meaning a lower score was more useful for ruling out near-term conversion than for making a firm dementia forecast.
- Year 1: AUC reached 0.74, with sensitivity of 74.6% and specificity of 66.0%.
- Year 2: AUC reached 0.72, with sensitivity of 76.5% and specificity of 60.0%.
- Year 3: AUC was 0.66, with sensitivity of 70.1% and specificity of 59.1%.
Over the full 0-12 year window, the association stayed statistically significant but weakened. That constraint makes RVI-AD a near-term conversion marker rather than a precise decade-long forecast from one scan.
The Clinical Use Case Would Need More Validation
The strongest possible use is not diagnosing Alzheimer’s disease by MRI alone. The more realistic use is triage: identifying people with MCI whose structural MRI already looks more aligned with Alzheimer’s disease and who may need closer follow-up or additional biomarker testing.
The healthy-cohort findings also suggest a prevention test. RVI-AD reflected APOE4 and cardiovascular risk before dementia was present.
If replicated, the index could help researchers test whether vascular-risk reduction changes the Alzheimer’s-like MRI pattern over time.
- No amyloid comparison in conversion: the study did not directly compare RVI-AD against amyloid status for predicting dementia conversion.
- Cohort differences: the Amish, UK Biobank, and ADNI samples differed in age, setting, ancestry mix, and risk level.
- Atlas limitation: the MRI regions came from standard anatomical atlases, not an Alzheimer’s-optimized pattern map.
The direct conclusion is still specific. RVI-AD turned standard MRI features into a distributed Alzheimer’s-pattern score, detected risk-linked structure in healthy adults, and predicted which MCI participants were more likely to convert to dementia in the near term.
Citation: DOI: 10.1038/s41380-026-03617-0. Study authors et al. Kochunov et al. Alzheimer’s disease-like brain pattern biomarker: capturing risks and predicting disease onset. Molecular Psychiatry . 2026.
Study Design: MRI biomarker development and validation across ADNI, OASIS, Amish Connectome Project, UK Biobank, and ADNI conversion cohorts.
Sample Size: Reference map from 571 people; risk analyses in 335 ACP participants and 26,010 UK Biobank participants; conversion analysis in 1,932 ADNI participants.
Key Statistic: In MCI participants, baseline RVI-AD predicted 0-3 year dementia conversion with OR 2.16, AUC 0.70, and p < 2 x 10^-16.
Caveat: RVI-AD needs further validation against amyloid, tau, blood, and clinical prediction models before it can be treated as a clinical screening tool.