TL;DR: A 2026 study in European Journal of Nuclear Medicine and Molecular Imaging found that semiquantitative [123I]FP-CIT SPECT metrics, especially caudate-to-putamen and sensorimotor-to-limbic ratios, helped distinguish Parkinson’s disease from atypical parkinsonian syndromes, while a random forest classifier remained more useful as decision support than as a standalone diagnosis.
Key Findings
- 706-patient cohort: The study included 487 Parkinson’s disease patients and 219 patients with atypical parkinsonian syndromes.
- Four APS groups: Atypical cases included PSP (n = 127), MSA-P (n = 37), MSA-C (n = 12), and CBD (n = 43).
- AUC up to 0.95: Caudate-to-putamen and sensorimotor-to-limbic ratios showed the strongest discrimination for several Parkinson’s-versus-APS comparisons.
- 64% random forest accuracy: The integrated classifier achieved 0.64 overall accuracy, with macro-balanced accuracy of 0.687 and macro F1 of 0.432.
- High specificity: Per-class specificities stayed high, including 0.94 for CBD, 0.98 for MSA-C, 0.92 for MSA-P, and 0.84 for PSP.
Source: European Journal of Nuclear Medicine and Molecular Imaging (2026) | Fernández-Rodríguez et al.
[123I]FP-CIT SPECT is a dopamine-transporter brain imaging test used to evaluate presynaptic dopaminergic function. In clinical practice, the scan is often read visually, but the spatial pattern of striatal uptake can contain more information than a normal-versus-abnormal label.
The distinction matters clinically because atypical parkinsonian syndromes such as progressive supranuclear palsy, multiple system atrophy, and corticobasal degeneration often progress faster and respond less well to standard dopaminergic treatment.
FP-CIT SPECT Metrics Were Tested in 706 Patients
The cross-sectional cohort included 487 patients with Parkinson’s disease and 219 patients with atypical parkinsonian syndromes. The atypical group was divided into progressive supranuclear palsy, multiple system atrophy parkinsonian type, multiple system atrophy cerebellar type, and corticobasal degeneration.
Researchers quantified striatal [123I]FP-CIT uptake using both anatomical and functional parcellations. Anatomical regions included caudate, anterior putamen, posterior putamen, and ventral striatum, while functional regions included limbic, executive, and sensorimotor territories.
- Anatomical ratios: Caudate-to-anterior-putamen and caudate-to-posterior-putamen ratios tested whether regional dopamine-transporter patterns separated diagnoses.
- Functional ratios: Sensorimotor-to-limbic and related ratios tested whether functional striatal organization added diagnostic information.
- Asymmetry metrics: Laterality measures assessed whether one-sided versus symmetric involvement helped classify subtypes.
The analysis therefore went beyond a simple visual scan read. It asked whether structured uptake ratios could capture disease-specific dopaminergic topography.
Caudate-to-Putamen Ratios Separated Parkinson’s Disease From Several APS Groups
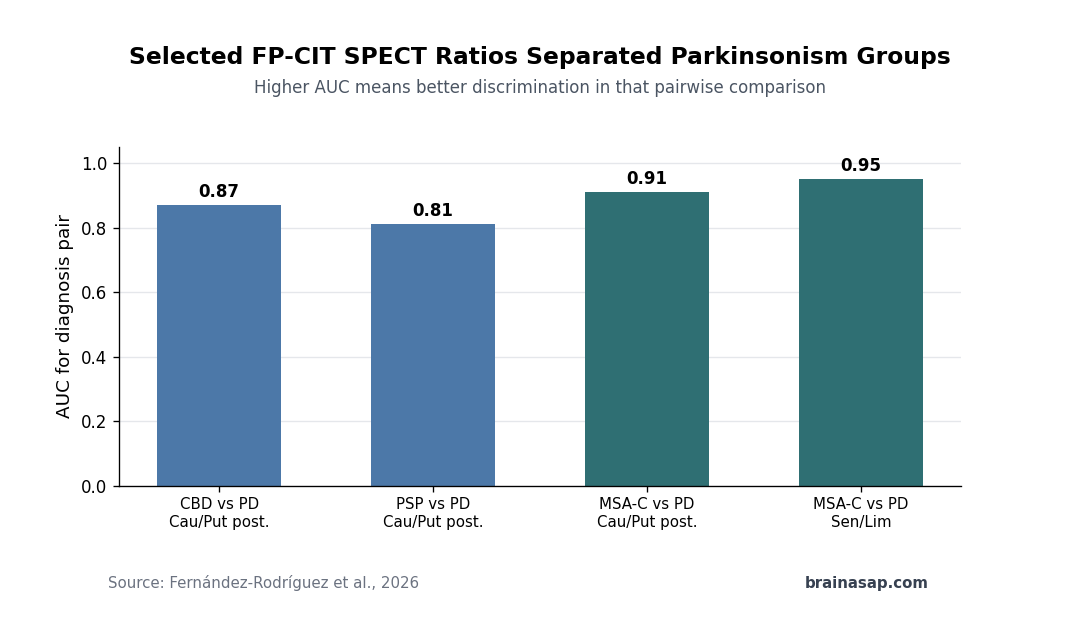
The strongest single-metric results involved inter-regional ratios. Caudate-to-putamen and sensorimotor-to-limbic ratios reached receiver operating characteristic area-under-the-curve values up to 0.95 in selected comparisons.
For corticobasal degeneration versus Parkinson’s disease, caudate-to-putamen ratios performed well, with reported AUC values of 0.84 for the anterior putamen ratio and 0.87 for the posterior putamen ratio.
- PSP versus PD: Caudate-to-putamen ratios showed moderate to high discrimination, including AUC = 0.81 for the posterior putamen ratio.
- MSA-C versus PD: The caudate-to-posterior-putamen ratio reached AUC = 0.91.
- Functional ratio: The sensorimotor-to-limbic ratio reached AUC = 0.95 for MSA-C versus PD, although the MSA-C sample was small.
MSA-P was harder to separate from Parkinson’s disease. The study reported only moderate discrimination for several metrics, consistent with clinical experience that MSA-P can look more similar to Parkinson’s disease on dopaminergic imaging.
Random Forest Classification Had High Specificity but Modest Accuracy
The machine-learning component integrated the semiquantitative metrics into a random forest classifier. Overall accuracy was 0.64, but class imbalance made that figure a poor summary of performance.
A naive classifier that always predicted Parkinson’s disease would reach 0.69 accuracy because Parkinson’s disease was the largest group. The study therefore emphasized macro-balanced accuracy, macro F1, sensitivity, specificity, and per-class performance rather than overall accuracy alone.
- Macro-balanced accuracy: The classifier reached 0.687, reflecting performance across classes rather than dominance by the largest class.
- Macro F1: The macro F1 score was 0.432, showing that minority-class detection remained difficult.
- Specificity: Specificity was high for atypical classes, including 0.94 for CBD, 0.98 for MSA-C, 0.92 for MSA-P, and 0.84 for PSP.
Clinically, the classifier is best used as decision support. A high-specificity pattern may strengthen suspicion for an atypical syndrome, but low sensitivity for some classes means many true atypical cases could still be missed.
Two Imaging Pathways Structured the Diagnostic Tree
The simplified decision pathway centered on the caudate-to-posterior-putamen ratio. Lower ratios tended to group PSP, corticobasal degeneration, and MSA-C, while higher ratios tended to group Parkinson’s disease and MSA-P.
Within those broad branches, additional measures refined the classification. Lower contralateral sensorimotor uptake pointed toward PSP, while ipsilateral caudate and asymmetry measures helped separate corticobasal degeneration from MSA-C.
- Lower-ratio branch: PSP, CBD, and MSA-C were mainly separated by sensorimotor uptake, caudate binding, and laterality.
- Higher-ratio branch: Parkinson’s disease and MSA-P were separated partly by anterior striatal binding and sensorimotor-to-cognitive ratios.
- Variable importance: Caudate-to-putamen ratios and posterior putamen asymmetry emerged as important model features.
That structure is clinically useful because it maps machine-learning decisions back onto interpretable striatal anatomy rather than producing an opaque output.
Age Imbalance and Small MSA-C Counts Limit Certainty
The paper’s strength is the relatively large combined cohort and the integrated anatomical-functional metric set. Its main limits are group imbalance, older ages in PSP and CBD, and small samples for some atypical subtypes.
The MSA-C group had only 12 patients, so its high AUC values should be treated cautiously. A small group can produce unstable sensitivity estimates even when a ratio looks excellent.
The best clinical use is therefore additive. Semiquantitative FP-CIT SPECT metrics can support expert clinical assessment, especially when atypical parkinsonism is suspected, but the model should not replace longitudinal examination, MRI, clinical criteria, or specialist follow-up.
Citation: DOI: 10.1007/s00259-026-08022-x. Fernández-Rodríguez et al. Semiquantitative [123I]FP-CIT SPECT metrics combined with machine learning improve clinical differentiation of Parkinson’s disease and atypical parkinsonian syndrome. European Journal of Nuclear Medicine and Molecular Imaging. 2026.
Study Design: Cross-sectional diagnostic imaging study using semiquantitative FP-CIT SPECT metrics and random forest classification.
Sample Size: 706 patients: 487 with Parkinson’s disease and 219 with atypical parkinsonian syndromes.
Key Statistic: Selected ratios reached AUC values up to 0.95, while the random forest classifier had 0.64 overall accuracy and high per-class specificity for atypical groups.
Caveat: Some atypical subgroups were small, especially MSA-C, and the classifier is better viewed as high-specificity decision support than a standalone diagnostic tool.