TL;DR: A 2026 preprint in medRxiv warned that a standard Alzheimer’s disease biomarker-clock analysis can create a countdown paradox, where later biomarker-clock ages appear linked to faster mild cognitive impairment onset because of the way remaining time is calculated.
Key Findings
- 100% false positives in simple null simulations: The standard countdown analysis rejected the null in every Study 1 null scenario.
- 30.6% to 100% false positives in realistic simulations: Under biomarker-trajectory scenarios, the standard Cox approach remained strongly inflated.
- Five biomarkers tested: The empirical analyses covered BIOCARD cerebrospinal fluid (CSF) Aβ42/Aβ40, BIOCARD CSF p-tau181, BIOCARD plasma p-tau181, ADNI amyloid positron emission tomography (PET), and ADNI plasma p-tau217.
- All standard countdown HRs exceeded 1: Across the five biomarker analyses, standard countdown hazard ratios ranged from 1.94 to 3.34.
- Time-varying methods stayed near nominal error: TV-BC and TV-AABC formulations maintained roughly 5% type I error in the simple null simulations.
Biomarker clocks estimate the age when a person crosses an Alzheimer’s disease biomarker landmark, such as amyloid positivity, tau positivity, or another modeled pathological threshold.
The goal is to ask whether the timing of that landmark predicts mild cognitive impairment (MCI) symptom onset.
The 2026 analysis focused on a specific statistical trap. If researchers calculate the remaining time from a biomarker-clock event to MCI onset, then regress that remaining time on the age at the biomarker-clock event, the predictor is built into the outcome.
Remaining Time Mechanically Shrinks as Biomarker-Clock Age Rises
The source names the artifact the countdown paradox. Remaining time is calculated as age at symptom onset minus age at biomarker-clock event, often abbreviated AABC.
That subtraction creates a built-in relationship. As the biomarker-clock age gets later, the remaining countdown to symptom onset tends to get shorter, even when the biomarker-clock age has no real disease-prediction value.
The practical problem is that this can make a later AABC appear harmful. A standard Cox proportional hazards model can return a hazard ratio above 1.
That number may be read as “later positivity predicts faster progression,” even when the association is partly structural.
The issue is not that Alzheimer’s biomarkers are useless. Amyloid and phosphorylated tau can still mark elevated clinical risk.
The narrower warning is that a specific remaining-time regression can distort the meaning of age-at-positivity effects.
Simulations Showed Severe False-Positive Inflation
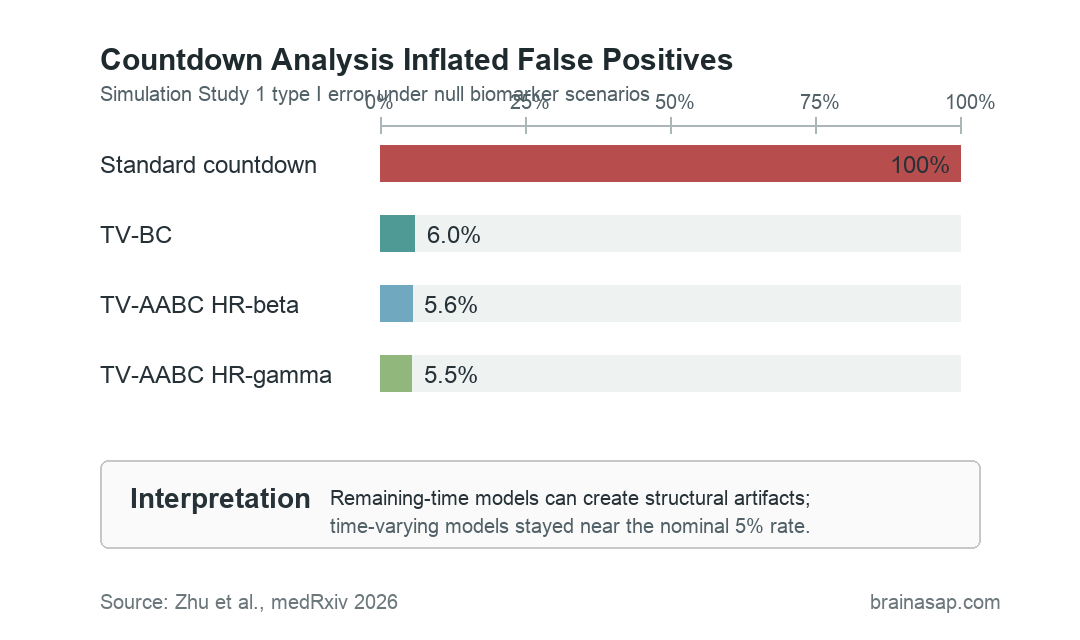
The researchers first tested the problem in simulations where the truth was known. Under null scenarios in Study 1, the biomarker was generated independently of symptom onset.
Even then, the standard countdown analysis produced 100% false positive rates.
Time-varying methods behaved differently. TV-BC stayed around 4.0% to 6.0% type I error, TV-AABC HR-beta stayed around 3.8% to 5.6%, and TV-AABC HR-gamma stayed around 4.4% to 5.5%.
A second simulation study used more realistic biomarker trajectories. The standard analysis still showed inflated type I error, ranging from 30.6% to 100% across scenarios.
Direction was another problem. In non-null scenarios, the standard countdown analysis identified the correct direction for harmful biomarkers in only 0% to 30.6% of replications.
The time-varying approaches tracked the correct direction in 70.7% to 100.0% of replications.
BIOCARD and ADNI Tested Five Alzheimer Biomarkers
The empirical analyses used two longitudinal Alzheimer cohorts. BIOCARD began with cognitively unimpaired participants and long follow-up; ADNI supplied amyloid PET and plasma p-tau217 analyses in older participants.
The five biomarker analyses were:
- BIOCARD CSF Aβ42/Aβ40: 238 participants with 83 MCI events in the full covariate-complete analysis.
- BIOCARD CSF p-tau181: The same CSF cohort supported a second cerebrospinal-fluid tau analysis.
- BIOCARD plasma p-tau181: 200 participants with 37 MCI events.
- ADNI amyloid PET: 575 participants with 106 MCI or dementia onset events.
- ADNI plasma p-tau217: 801 participants with 162 onset events.
In the standard countdown analysis, all five biomarker hazard ratios exceeded 1. The range was 1.94 for ADNI plasma p-tau217 to 3.34 for ADNI amyloid PET.
Those standard results all matched the countdown-paradox prediction. They looked statistically strong, but simulation evidence changed the interpretation.
Standard countdown significance alone should not be treated as proof that later biomarker positivity accelerates MCI onset.
Time-Varying Analysis Used the Age Scale Instead
The proposed solution was a time-varying effect analysis. Instead of starting the clock at biomarker positivity and modeling the remaining countdown, the time-varying approach uses age as the time scale.
Each participant contributes person-time before biomarker positivity and after biomarker positivity. People who never become positive still contribute not-yet-positive person-time, instead of being discarded from the countdown subset.
- TV-BC model: Tests whether reaching biomarker positivity increases the hazard of MCI onset compared with not-yet-positive time.
- TV-AABC model: Adds whether the age at biomarker-clock event changes hazard among people who have already become positive.
- Clinical interpretation: The method separates “has the biomarker event happened?” from “does earlier versus later positivity carry extra prognostic value?”
That distinction changed the message. In BIOCARD, biomarker positivity increased MCI hazard for CSF Aβ42/Aβ40 and plasma p-tau181, while the effect for CSF p-tau181 did not reach significance.
Among positive BIOCARD participants, earlier positivity was associated with higher MCI hazard across all three biomarkers.
In ADNI, amyloid PET positivity increased hazard, but age at amyloid onset did not significantly change hazard among positive individuals. Plasma p-tau217 positivity increased hazard, and earlier p-tau217 positivity also carried additional risk.
Biomarker-Clock Claims Need Method Checks
The main reader-facing point is methodological. Alzheimer’s biomarker clocks may still matter, but analyses should avoid building the predictor into the outcome and then interpreting the artifact as biology.
The authors offered three practical recommendations:
- Use a time-varying effect analysis: Especially when age at a biomarker-clock event is being evaluated against time to MCI onset.
- Report both TV-BC and TV-AABC: One tests biomarker positivity; the other tests whether age at positivity adds prognostic value among positive participants.
- Interpret results on the age scale: Age-based time-varying models avoid the remaining-time structural coupling.
Several limits still apply. The analysis is a preprint, and the simulations used simplified data-generating models.
The cohort samples were predominantly non-Hispanic White and highly educated. The time-varying models also treated estimated biomarker-positive ages as fixed rather than propagating trajectory-estimation uncertainty.
For clinical translation, the narrow conclusion is enough: biomarker-clock timing should not be treated as prognostic until the analysis design rules out the countdown artifact.
Re-evaluating published countdown-style findings with time-varying models may clarify which Alzheimer biomarker-clock effects are genuine.
Citation: DOI: 10.64898/2026.06.19.26355994. Zhu et al. The countdown paradox: A time-varying effect analysis of age at biomarker-clock event as a predictor of MCI symptom onset. medRxiv. 2026.
Study Design: Simulation study plus empirical time-varying analysis of Alzheimer biomarker-clock effects in BIOCARD and ADNI cohorts.
Sample Size: Five biomarker analyses, including 238 BIOCARD CSF participants, 200 BIOCARD plasma participants, 575 ADNI amyloid PET participants, and 801 ADNI plasma p-tau217 participants.
Key Statistic: The standard countdown analysis produced 100% false positives in simple null simulations and 30.6% to 100% false positives in realistic biomarker-trajectory simulations.
Caveat: The report is preprint-stage methods evidence, and the empirical cohorts were not broad enough to settle clinical use of biomarker-clock timing.