TL;DR: A 2026 preprint in medRxiv used amyloid positron-emission tomography, tau molecular imaging, and structural MRI to build individualized Alzheimer’s disease biomarker axes from ADNI and validate them in OASIS.
Key Findings
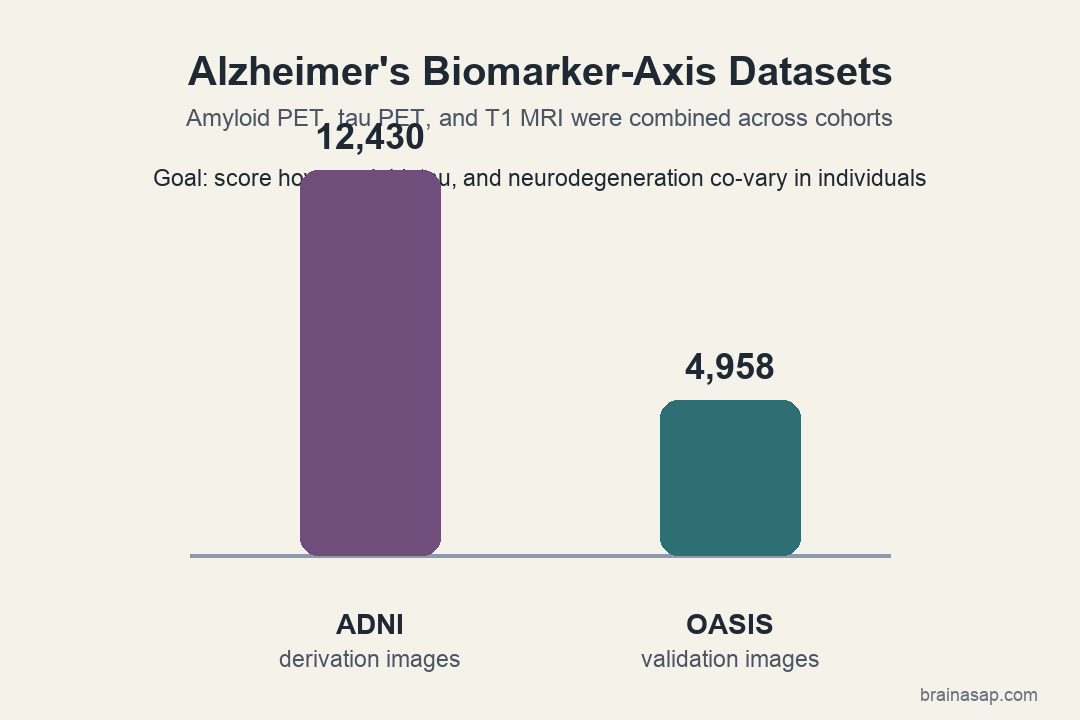
- 12,430 ADNI images: The pipeline harmonized longitudinal amyloid-beta and tau positron-emission tomography images plus T1 MRI gray matter images from ADNI.
- 4,958 OASIS images: The derived biomarker patterns were externally tested in an independent OASIS imaging cohort.
- A-T-N coupling: The method quantified how amyloid-beta, tau, and neurodegeneration co-varied across brain regions at the individual level.
- Clinical transition prediction: Subject-level axis scores were reported to predict clinical transitions and map onto domain-specific cognition.
- Biomarker links: The axes connected with APOE e4 and blood or cerebrospinal fluid (CSF) markers of neurodegeneration, neuroaxonal injury, and astrocyte activation.
Source: medRxiv (2026) | Authors not listed in capture
Alzheimer’s disease staging often asks whether amyloid, tau, and neurodegeneration are present. This preprint asked a different question: how those markers line up spatially in each person.
The study focused on A-T-N coupling, meaning the relationship among amyloid-beta deposition, tau accumulation, and neurodegeneration. Instead of treating those markers as separate boxes, the pipeline tried to summarize their shared spatial patterns.
ADNI Molecular Imaging and MRI Anchored the Alzheimer’s Biomarker Pipeline
The main dataset came from the Alzheimer’s Disease Neuroimaging Initiative (ADNI). The analysis used 12,430 longitudinal images spanning amyloid-beta imaging, tau imaging, and T1 MRI gray matter measures.
Those modalities carry different information:
- Amyloid imaging: estimates where amyloid-beta deposition is present across the brain.
- Tau imaging: tracks tau accumulation, which often relates more closely to symptoms and disease stage.
- T1 MRI gray matter: captures structural neurodegeneration through tissue loss or morphometric change.
The analysis used mixed-effects modeling to harmonize the longitudinal data. It then used linked component analysis to derive multimodal variation components, described in the source as stage-specific multimodal axes.
The goal was not another single biomarker cutoff. It was a portable score that could say how a person’s amyloid, tau, and neurodegeneration patterns co-express across brain regions.
Multimodal Axes Separated Early, Typical, and Atypical Alzheimer Patterns
The preprint reported a small set of reproducible biomarker patterns. In cognitively unimpaired people, the method recapitulated early tau-weighted variation.
In cognitively impaired people, the axes captured more Alzheimer-like coupling across amyloid-beta, tau, and neurodegeneration. The paper also described atypical patterns in both cognitively unimpaired and impaired participants.
Those atypical patterns included posterior and frontal-weighted profiles:
- Posterior pattern: variation weighted toward the precuneus and occipitoparietal regions.
- Fronto-insular/frontal pattern: variation weighted toward frontal and insular regions.
- Stage-sensitive structure: the source described different coupling profiles in cognitively unimpaired versus cognitively impaired groups.
Clinically, Alzheimer’s disease does not look identical across patients. Two people can share biomarker positivity but differ in where pathology is most expressed and which cognitive domains are affected.
OASIS Validation Tested Whether the Biomarker Scores Could Travel
External validation used 4,958 images from the OASIS cohort. A second dataset helps test whether a high-dimensional imaging model can travel beyond the cohort where it was built.
The extracted axes reportedly generalized in the independent cohort. Simulations also tested robustness to missing data, high dimensionality, and cross-cohort variability.
Those checks do not make the method ready for routine clinical use. They do address a central weakness of many imaging pipelines: results that depend too much on one scanner mix, one study design, or one missing-data pattern.
Axis Scores Linked to Cognition, APOE e4, and Fluid Biomarkers
The subject-level scores reportedly mapped onto domain-specific cognition. The source also linked them with APOE e4, a genetic risk variant for Alzheimer’s disease.
The same framework connected with blood and CSF measures tied to neurodegeneration, neuroaxonal injury, and astrocyte activation. Those links matter because molecular imaging and MRI are expensive, while fluid biomarkers are more scalable.
The preprint described several candidate uses:
- Biomarker discovery: testing whether a person’s spatial A-T-N profile aligns with fluid markers or risk factors.
- Clinical stratification: grouping people by how amyloid, tau, and neurodegeneration co-occur, not only by whether each marker is positive.
- Trial enrichment: identifying participants whose pathology pattern fits a treatment mechanism or expected progression route.
The model also predicted clinical transitions, according to the source. The capture does not provide enough transition statistics to treat it as a ready prognostic calculator.
ADNI and OASIS Validation Still Leaves the Alzheimer’s Axes Preprint-Level
The strongest part of the source is the scale and cross-cohort design: 12,430 ADNI images for derivation and 4,958 OASIS images for validation.
The main limitation is that the capture does not include full coefficients, transition rates, or performance metrics. The available source text therefore does not support a claim that the axes improve diagnosis or prognosis beyond existing clinical workflows.
Several caveats should stay visible:
- Preprint status: the manuscript had not completed peer review at the time of posting.
- Dataset dependence: ADNI and OASIS are valuable research cohorts, but they are not the same as every memory clinic population.
- Method complexity: linked component analysis and longitudinal harmonization require specialized imaging infrastructure.
- Missing statistics: the source capture names clinical prediction and biomarker links but does not provide enough exact effect sizes for bedside interpretation.
The narrow conclusion is that Alzheimer’s disease heterogeneity may be easier to study when amyloid, tau, and neurodegeneration are treated as coupled spatial patterns rather than isolated markers.
Citation: DOI: 10.64898/2026.05.24.26353955. Multimodal axes reveal individualized amyloid-beta, tau, and neurodegeneration coupling in aging and Alzheimer’s disease. medRxiv. 2026.
Study Design: Longitudinal multimodal neuroimaging methods study using amyloid imaging, tau imaging, T1 MRI, linked component analysis, simulations, and external cohort validation.
Sample/Model: 12,430 ADNI images for model derivation and 4,958 OASIS images for external validation.
Key Statistic: The source reports 12,430 ADNI images and 4,958 OASIS images across amyloid-beta/tau molecular imaging and gray matter MRI workflows.
Caveat: The capture does not provide full predictive-performance statistics, so the method should be read as a research stratification approach, not a clinical test.