TL;DR: A 2026 medRxiv preprint used quantitative multi-parametric MRI mapping in 245 BeLOVE participants and found that white matter hyperintensities had lower MTsat and R1 plus higher proton density, with nearby normal-appearing white matter also showing microstructural changes linked to MoCA, a brief cognitive screening score.
Key Findings
- 245 MRI participants: The analysis used cerebral MRI data from 245 people in the prospective BeLOVE study, with mean age 62 years.
- 121 had two-year cognition data: MoCA, a brief cognitive screening test, was assessed at baseline and again at 2-year follow-up in a longitudinal subgroup.
- MTsat was lower in lesions: Magnetization transfer saturation was lower in white matter hyperintensities than contralesional white matter (beta = -0.48, p < 0.001).
- R1 was also lower: Longitudinal relaxation rate was lower in white matter hyperintensities than contralesional white matter (beta = -0.07, p < 0.001).
- Proton density was higher: Proton density was higher in white matter hyperintensities (beta = 2.32, p < 0.001), consistent with increased water content.
Source: medRxiv (2026) | Ali et al.
Quantitative MRI Looked Beyond Visible White Matter Hyperintensities
White matter hyperintensities, or WMH, are bright areas seen on certain MRI scans. They are common in cerebral small vessel disease and have been linked to stroke risk, gait problems, and cognitive decline.
The challenge is that conventional MRI shows the visible lesion but may miss subtler injury in nearby tissue that still looks normal. This preprint tested whether quantitative multi-parametric mapping could detect that hidden border-zone injury.
The researchers focused on three MRI-derived tissue measures. MTsat, or magnetization transfer saturation, is sensitive to myelin and macromolecular tissue structure.
R1, or longitudinal relaxation rate, can reflect tissue integrity and myelin-related properties. Proton density, or PD, is sensitive to tissue water content.
The clinical idea is simple: if the tissue around a visible lesion is already altered, then white matter injury may spread farther than the fluid-attenuated inversion recovery, or FLAIR, MRI image suggests.
FLAIR is a common MRI sequence used to highlight white matter hyperintensities.
That could make perilesional normal-appearing white matter an early marker of small vessel disease burden.
BeLOVE MRI Data Included 245 Participants
The analysis included 245 participants from the Berlin Longterm Observation of Vascular Events study. The mean age was 62 years, and 29.8% of the cohort was female.
Researchers analyzed white matter hyperintensity regions, perilesional normal-appearing white matter at 1, 2, and 3 mm from the lesion border, and mirrored contralesional white matter. That setup let them compare visible lesion tissue, nearby tissue, and a reference region in the opposite hemisphere.
Cognition was assessed with the Montreal Cognitive Assessment, or MoCA. Baseline MoCA data were available for 173 participants, and follow-up data at 2 years were available for 121 participants.
The paper is a preprint, so it has not yet completed peer review. The results are relevant for tracking a research direction, but they should not be treated as clinical guidance until reviewed and replicated.
The BeLOVE setup is also important because it separated visible lesions from the surrounding tissue in a structured way.
A 1 mm ring beside a lesion can capture different biology than a 3 mm ring, and both may differ from tissue that appears similar but sits in the opposite hemisphere.
That design gives the study a more detailed map than a simple lesion-volume analysis.
MTsat, R1, and Proton Density Showed a Lesion Gradient
The main imaging result was a spatial gradient. White matter hyperintensities showed the strongest microstructural abnormality, but nearby normal-appearing white matter also differed from mirrored contralesional tissue.
Compared with contralesional white matter, MTsat was lower in WMH, with beta = -0.48.
MTsat was also lower in perilesional tissue at 1, 2, and 3 mm.
Because MTsat is sensitive to myelin-related tissue structure, the finding is consistent with injury extending beyond the visible lesion edge.
R1 showed a similar but smaller pattern.
Researchers measured a lower R1 value inside WMH than in contralesional white matter, and perilesional tissue also differed from the reference region.
The researchers interpreted this as another sign that tissue integrity changes radiate beyond the FLAIR-visible lesion.
Proton density moved in the opposite direction.
PD was higher in WMH than contralesional white matter, with beta = 2.32, and remained higher in perilesional regions.
Higher proton density in lesion and perilesional tissue fits increased free water content, edema-like tissue change, or less compact microstructure.
Perilesional R1 Was Associated With MoCA Scores
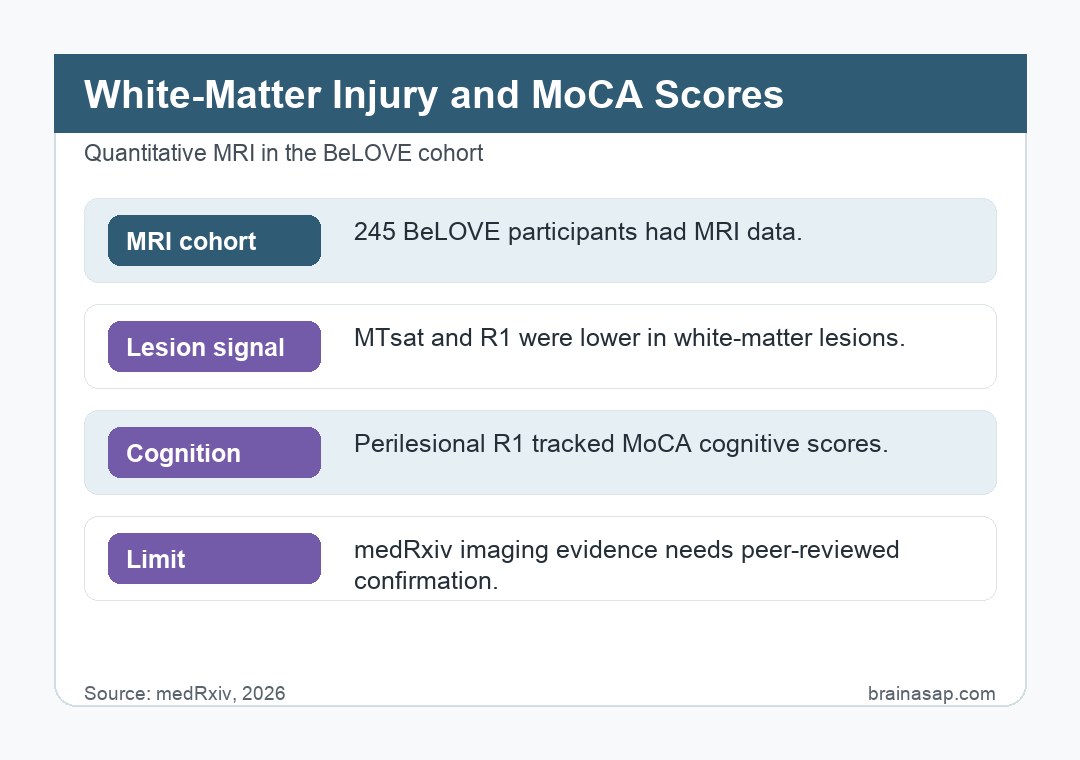
The cognitive analysis connected the imaging signal to clinical relevance. Among the three maps, perilesional R1 showed the clearest association with MoCA performance.
- Baseline cognition: Higher perilesional R1 was associated with better MoCA score.
- Follow-up cognition: The same R1 direction remained at 2 years.
- Metric specificity: MTsat and proton density did not show the same cognitive association.
At baseline, higher perilesional R1 was associated with better MoCA score (beta = 1.457, p = 0.019). At 2-year follow-up, R1 also remained associated with cognitive performance (beta = 1.575, p = 0.045).
Spearman correlation analysis supported the same direction.
R1 had a weak positive association with baseline MoCA and a stronger moderate association at follow-up.
MTsat showed no baseline association and only a moderate, non-significant association at follow-up, while PD was not associated with cognition.
Visible WMH volume is already known to relate to cognitive risk. The preprint suggests that a more sensitive tissue map around lesions may add information about cognitive performance beyond the visible bright spot itself.
Cerebrovascular Risk Factors Were More Diffuse Than Border-Specific
The researchers also tested cerebrovascular risk factors such as age, body-mass index, waist-hip ratio, and insulin resistance. Some factors were associated with MPM metrics, especially MTsat and R1.
However, the paper did not find strong evidence that these risk factors specifically intensified the immediate lesion border zone. The researchers interpreted their influence as more diffuse across white matter microstructure rather than sharply concentrated at the visible edge of WMH.
That result keeps the interpretation from becoming too neat.
Perilesional tissue may reflect local injury around an established lesion, while age, adiposity, and metabolic strain may shape white matter health across a broader region.
Quantitative MRI can help separate those patterns when conventional MRI mainly shows the final bright lesion.
That distinction helps separate two overlapping processes: focal lesion-related injury around WMH, and broader vascular or metabolic effects on white matter tissue health.
Preprint Status and MRI Design Limit the Claim
The strongest claim is technical and mechanistic: quantitative MRI detected microstructural differences in tissue that looked normal on conventional imaging. The clinical claim is more cautious: those differences, especially R1, were associated with MoCA scores.
Several limits matter:
- Preprint status: The manuscript has not completed peer review.
- Observational design: The study links MRI metrics with cognition but does not prove causation.
- Moderate cognitive range: Median MoCA scores were relatively preserved, around 26 at baseline and follow-up.
- Method sensitivity: Quantitative MPM is promising but not yet a routine clinical decision tool for individual patients.
The clearest application is to refine how researchers measure small vessel disease. Conventional MRI can identify visible lesions; quantitative MPM may help measure the tissue injury spreading around them.
If future longitudinal studies confirm the pattern, perilesional normal-appearing white matter could become a measurable target for tracking disease progression, treatment effects, or cognitive vulnerability before standard scans show a larger lesion burden.
Citation: DOI: 10.64898/2026.04.10.26350576. Ali et al. Microstructural Alterations in White Matter Hyperintensities and Perilesional Normal-Appearing White Matter Assessed by Quantitative Multiparametric Mapping – A BeLOVE Study. medRxiv. 2026.
Study Design: Observational quantitative MRI analysis of white matter hyperintensities, perilesional normal-appearing white matter, cerebrovascular risk factors, and MoCA cognition.
Sample Size: 245 BeLOVE participants with cerebral MRI; cognition was analyzed in 173 participants at baseline and 121 at 2-year follow-up.
Key Statistic: Perilesional R1 was associated with better MoCA score at baseline (beta = 1.457, p = 0.019) and 2-year follow-up (beta = 1.575, p = 0.045).
Caveat: Preprint observational data link MRI metrics with cognition but do not prove causation or individual clinical utility.