TL;DR: A 2026 Alzheimer’s & Dementia: Diagnosis, Assessment & Disease Monitoring study found that orbitofrontal and frontoinsular visual rating scales on MRI helped distinguish possible from probable behavioral variant frontotemporal dementia.
Key Findings
- bvFTD cohort: The study included 93 probable and 15 possible bvFTD patients, plus healthy controls for cross-sectional comparisons.
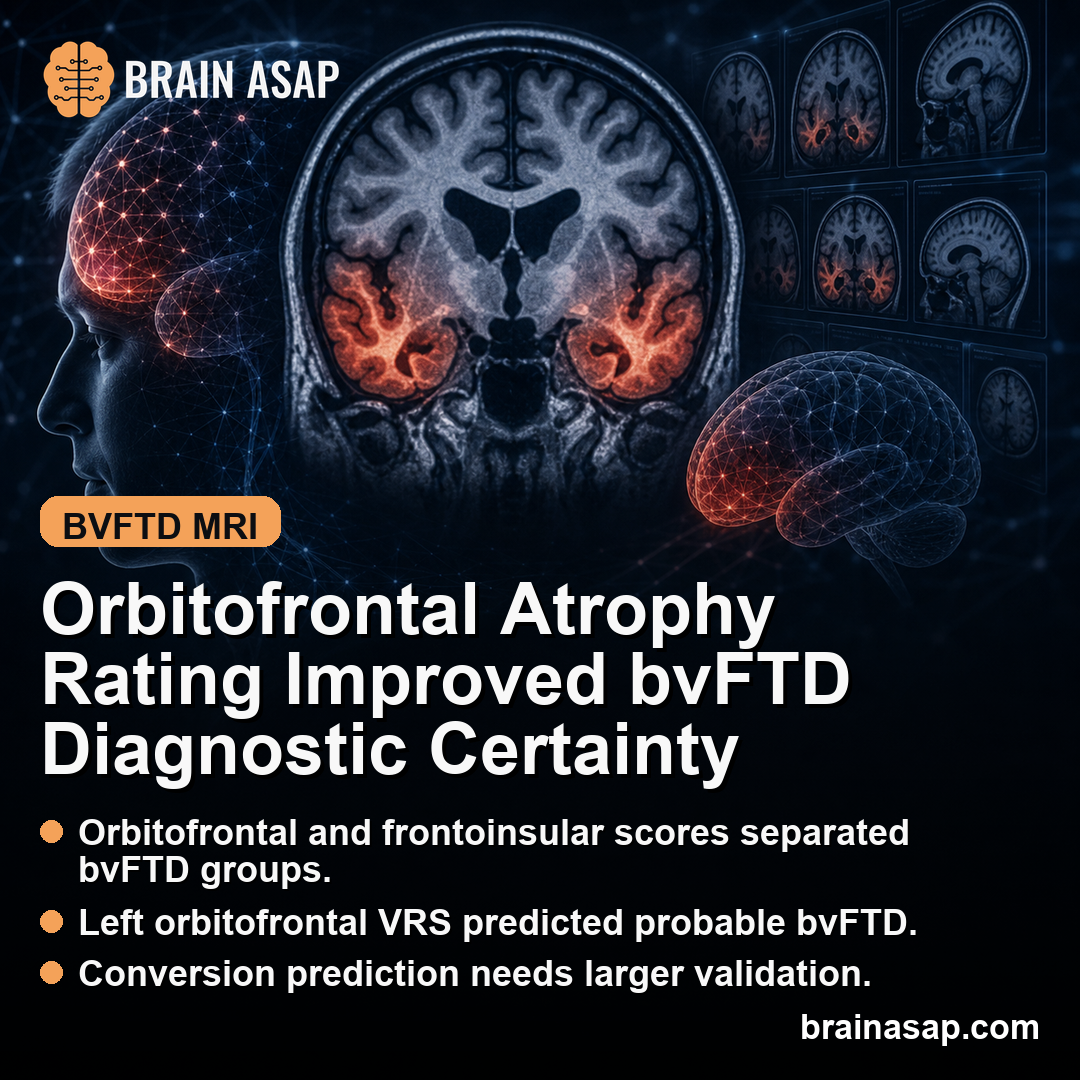
- Best regions: Orbitofrontal and frontoinsular atrophy scores best separated possible from probable bvFTD.
- Left orbitofrontal score: Baseline left orbitofrontal VRS predicted probable bvFTD with odds ratio 3.77.
- Conversion signal: Five of 10 possible bvFTD patients with follow-up progressed to probable bvFTD, and converters tended to have higher baseline left orbitofrontal scores.
- Caution: The possible bvFTD follow-up sample was small, so conversion prediction needs larger validation.
Source: Alzheimer’s & Dementia: Diagnosis, Assessment & Disease Monitoring (2026) | Beydoun et al.
Behavioral variant frontotemporal dementia, or bvFTD, is difficult to diagnose early because behavioral change can resemble psychiatric illness, atypical aging, or other dementias. Brain atrophy on MRI can increase diagnostic confidence, but routine clinical reads are not always standardized.
Researchers tested whether visual rating scales, or VRS, can quantify regional atrophy in bvFTD. These scales are simpler than automated volumetric pipelines and can be more practical in ordinary clinical settings.
The strongest findings centered on orbitofrontal and frontoinsular atrophy. Those regions helped distinguish possible from probable bvFTD and can help track diagnostic progression.
This is a practical diagnostic problem, not just an imaging-method problem. In early bvFTD, families can notice disinhibition, apathy, loss of empathy, compulsive behavior, or dietary change before structural MRI findings are obvious.
A standardized visual rating system can give clinicians a more consistent way to discuss whether the MRI pattern fits the syndrome. It is not as detailed as automated volume measurement, but it is easier to use across ordinary memory and neurology clinics.
Visual Rating Scales Quantified MRI Atrophy in bvFTD
The study included 93 probable bvFTD patients and 15 possible bvFTD patients. Five validated visual rating scales were applied to MRI scans by blinded raters.
The regions included orbitofrontal, anterior cingulate, anterior temporal, frontoinsular, and medial temporal areas. The researchers tested whether these scores separated possible from probable bvFTD and whether baseline scores predicted diagnostic conversion.
That design fits a common clinical problem. A patient can meet possible bvFTD criteria because symptoms are present, but imaging and progression evidence is not yet strong enough for probable bvFTD.
The difference between possible and probable bvFTD is important. Possible bvFTD can be based mainly on the clinical syndrome.
Probable bvFTD requires stronger evidence, including functional decline and imaging findings consistent with frontotemporal degeneration.
The study therefore asked something concrete: do simple MRI ratings help identify which possible cases already resemble probable bvFTD, and which cases may become clearer over time?
Orbitofrontal and Frontoinsular Scores Best Separated bvFTD Certainty
Probable bvFTD patients had greater atrophy than possible bvFTD patients in several frontal regions. The strongest discriminative performance came from orbitofrontal and frontoinsular ratings.
The area-under-the-curve values were:
- Left orbitofrontal: AUC 0.775.
- Right orbitofrontal: AUC 0.761.
- Left frontoinsular: AUC 0.716.
- Right frontoinsular: AUC 0.712.
AUC values above 0.7 are generally considered acceptable discrimination. These numbers do not make the ratings perfect diagnostic tests, but they suggest the scales carry useful information.
The pattern also matches what clinicians expect anatomically. Orbitofrontal and frontoinsular regions are repeatedly implicated in bvFTD because they support social behavior, salience, emotional regulation, inhibition, and goal-directed control.
The strongest AUC was not dramatically higher than the others, so the result should not be reduced to one brain region. The safer interpretation is that a frontal-salience pattern, especially orbitofrontal and frontoinsular atrophy, helped separate diagnostic certainty levels.
Clinically, possible bvFTD can sit in an uncomfortable middle zone. Symptoms can be concerning, but the MRI report can be described as mild, nonspecific, or uncertain.
A structured rating scale gives the imaging review a more reproducible language.
Left Orbitofrontal Atrophy Predicted Probable bvFTD Classification
When the strongest regions were entered into logistic regression, the left orbitofrontal visual rating scale was the main predictor. Patients with higher left orbitofrontal atrophy scores were more likely to be classified as probable bvFTD.
The reported odds ratio was 3.77, with a 95% confidence interval from 1.61 to 8.84. That suggests a sizable association between left orbitofrontal atrophy and diagnostic certainty at baseline.
This fits bvFTD biology. Orbitofrontal and frontoinsular regions are strongly tied to social behavior, inhibition, salience, and emotional regulation, all domains that can change in bvFTD.
The odds ratio should be read as an association within this cohort, not as a standalone clinical rule. A higher left orbitofrontal VRS score increased the odds of probable bvFTD classification, but diagnosis still depends on symptoms, progression, function, imaging, and differential diagnosis.
The caveat is important because bvFTD is one of the neurodegenerative syndromes most likely to overlap with psychiatric presentations. A visual rating score can support the case, but it cannot replace careful clinical history.
Possible-to-Probable bvFTD Conversion Needed Larger Samples
The longitudinal analysis was smaller. Ten possible bvFTD patients had at least one annual follow-up appointment recorded. Of those, five progressed to probable bvFTD and five did not.
Converters tended to have higher baseline left orbitofrontal scores than non-converters. The Mann-Whitney result was near significance at p = 0.053, but the regression model did not converge because the sample was too small.
The conversion finding is therefore preliminary. It is consistent with the baseline diagnostic result, but it should be treated as a signal for validation rather than a confirmed prediction rule.
The small follow-up group is still informative because it shows what future studies need to answer. If a possible bvFTD patient has early orbitofrontal atrophy, does that meaningfully raise the chance of progression to probable bvFTD over the next few years?
A larger study can test that conversion problem with enough converters and non-converters to estimate sensitivity, specificity, and practical thresholds. This study is closer to a proof-of-concept than a ready-to-use prediction calculator.
VRS Could Standardize bvFTD MRI Review
The practical advantage of visual rating scales is accessibility. Many clinics do not have automated volumetric MRI pipelines, specialized computational infrastructure, or large local datasets for single-patient prediction.
VRS can help in three ways:
- Diagnostic consistency: They make atrophy review more systematic across clinicians and sites.
- Progression monitoring: Repeated ratings can help track whether a possible bvFTD case is becoming structurally clearer.
- Trial enrichment: Region-specific atrophy scores can help identify patients more likely to progress.
Several limits remain. The number of possible bvFTD cases was small, and possible/probable group sizes were unequal.
Raters were blinded during image scoring, but the broad participant categories were known in advance.
Future studies need larger longitudinal samples and comparisons with psychiatric mimics, phenocopy cases, other dementias, and healthy aging. Those comparisons matter because the most difficult real-world cases are often not obvious bvFTD versus obvious control.
The measured conclusion: orbitofrontal and frontoinsular VRS scores look useful for bvFTD diagnostic certainty, especially left orbitofrontal atrophy. They should support clinical assessment, not replace it.
For clinicians, the best use is probably additive. A structured MRI rating can make the imaging component clearer, while the final diagnosis still rests on longitudinal behavior change, functional decline, neurological evaluation, and exclusion of alternative explanations.
Citation: DOI: 10.1002/dad2.70307. Beydoun et al. Quantitative assessment of brain atrophy in bvFTD: Implications for diagnostic conversion. Alzheimer’s & Dementia: Diagnosis, Assessment & Disease Monitoring. 2026;18:e70307
Study Design: Longitudinal bvFTD cohort study applying visual rating scales to MRI atrophy patterns.
Sample Size: 93 probable and 15 possible bvFTD patients, with 10 possible bvFTD patients included in the quantitative follow-up conversion analysis.
Key Statistic: Left orbitofrontal VRS predicted probable bvFTD classification with odds ratio 3.77.
Caveat: The possible-bvFTD follow-up group was small, so conversion prediction needs larger validation.