TL;DR: A 2026 preprint in medRxiv analyzed plasma proteomics in Alzheimer’s disease and mild cognitive impairment and found that four continuous molecular axes described the data better than hard subtype labels.
Key Findings
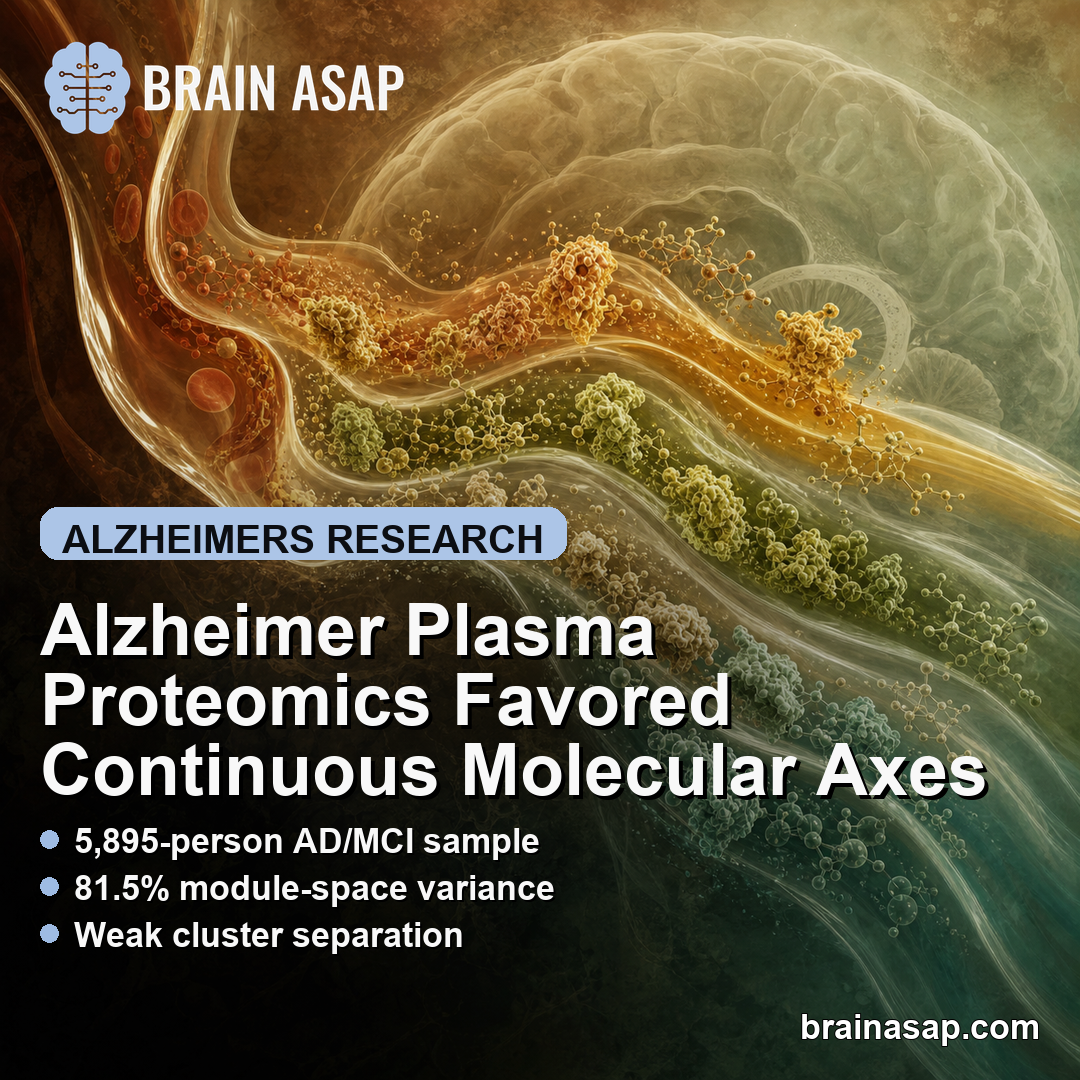
- 5,895-person AD/MCI sample: The discovery analysis used one record per participant from the Global Neurodegeneration Proteomics Consortium.
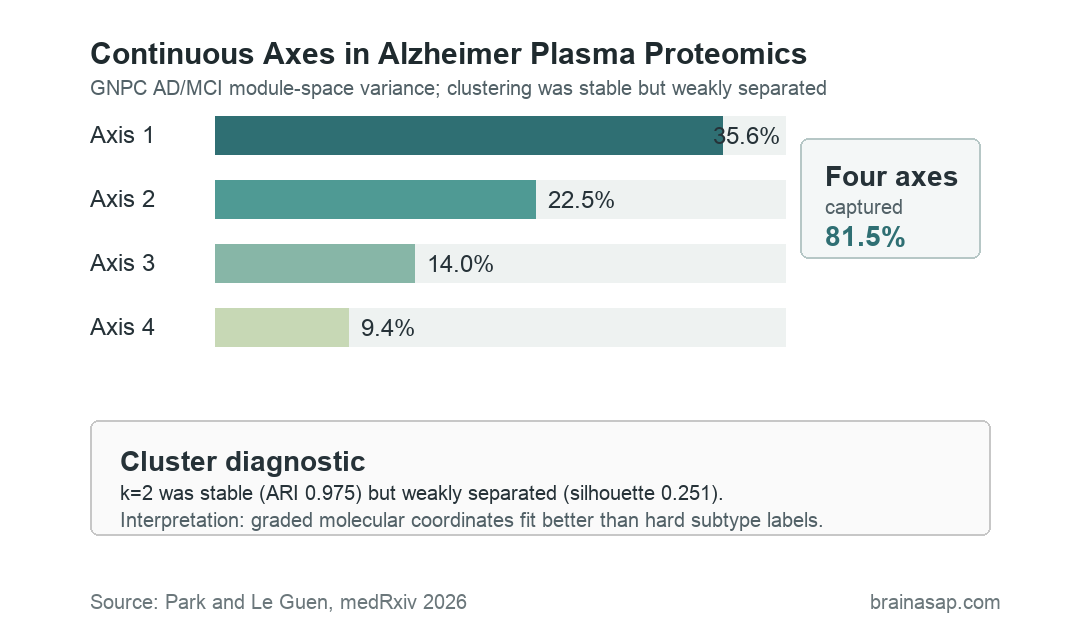
- 81.5% module-space variance: Four continuous axes captured most variation across nine Alzheimer’s and mild-cognitive-impairment protein coexpression modules.
- Weak cluster separation: A two-cluster solution was highly stable, with adjusted Rand index 0.975, but separation was weak, with silhouette width 0.251.
- Minimal clinical gain: After age, sex, APOE dosage, and the four axes were included, the two-cluster assignment barely changed AD-versus-MCI/SCD model fit.
- Systemic UK Biobank context: Projected axes related more strongly to APOE genotype, blood, kidney, lipid, inflammatory, and liver traits than to clear dementia-risk replication.
Plasma proteomics measures many circulating proteins at once. In Alzheimer’s research, that blood-based readout could help sort biological variation without relying only on spinal fluid, positron emission tomography (PET) imaging, or postmortem brain tissue.
The hard part is interpretation. Blood proteins can reflect brain disease, immune activity, vascular biology, kidney function, liver function, lipid metabolism, or general aging.
This analysis tested whether the signal resembled discrete Alzheimer’s disease subtypes or a graded molecular landscape.
Plasma Proteomics Did Not Form Clear Alzheimer Subtypes
The study focused on Alzheimer’s disease (AD), mild cognitive impairment (MCI), and subjective cognitive decline (SCD) records inside the Global Neurodegeneration Proteomics Consortium. Researchers built protein coexpression modules, then asked whether module patterns separated participants into clear molecular classes.
The most reproducible clustering answer was a k-means two-cluster solution. It split 5,895 participants into groups of 2,703 and 3,192, and repeated subsampling recovered nearly the same assignments.
Stability was not enough. The two groups occupied opposite regions of a dense continuous distribution rather than two cleanly separated clouds.
The reported silhouette width was 0.251, which the researchers treated as weak separation.
The key distinction is simple:
- Stable boundary: A clustering algorithm can draw a repeatable line through a continuous spread of patients.
- True subtype claim: The groups should be clearly separated, clinically informative, and supported by external biomarker data.
- This result: The stable boundary mostly discretized a gradient rather than identifying a strong subtype.
Four Molecular Axes Captured 81.5% of Protein Module Variation
When researchers treated the same data as continuous variation, the structure became clearer. Principal component analysis of nine non-grey AD/MCI protein modules produced four axes that explained 81.5% of module-space variance.
Those axes were not marketed as clinical scores. They were research coordinates that captured different protein contrasts across the Alzheimer’s continuum.
- Axis 1: A severity/systemic scaffold versus neural-guidance contrast, associated with AD versus MCI/SCD and Clinical Dementia Rating.
- Axis 2: A progression and vascular-glial coordinate, with the clearest internal progression signal.
- Axis 3: A mixed Clinical Dementia Rating slope coordinate with exploratory MRI associations.
- Axis 4: An APOE/apolipoprotein coordinate strongly tied to APOE genotype and lipid biology.
Axis labels were descriptive. A plasma protein pattern compatible with neural, vascular-glial, APOE, or systemic biology does not prove the measured proteins came from those tissues or cell types.
Clusters Added Little After Age, Sex, APOE, and Axes
The stronger test was whether cluster assignment added information after the continuous axes were already known. It mostly did not.
For AD versus MCI/SCD, adding the two-cluster assignment after age, sex, APOE dosage, and the four axes changed pseudo-R² by only 0.00011. For Clinical Dementia Rating, the change in R² was 0.00017.
The higher-k solutions did not rescue the subtype idea. Spectral clustering with k=3 was stable but weakly separated and included a 434-person tail group.
A Gaussian-mixture k=6 solution had poorer separation and uneven component sizes.
Precision-medicine language needs that distinction. A repeatable clustering output can appear tidy in a figure, but clinical use needs more than a reproducible label.
A clinically meaningful label should explain risk, progression, biomarker status, treatment response, or another patient difference beyond continuous measurements.
External Cohorts Kept the Interpretation Cautious
The Stanford Alzheimer’s Disease Research Center analysis tested frozen GNPC-derived axes against fluid biomarkers and imaging traits. The linked resource included 735 participants, but model-specific sample sizes were smaller.
Most fluid biomarker models used about 398 participants. MRI models used 164, amyloid PET used 121, and tau PET used 25.
Selected fluid biomarker associations passed correction, including associations involving pTau181, amyloid-beta 40, amyloid-beta 42, and amyloid-beta 42/40. Imaging and PET results did not provide consistent confirmation.
The UK Biobank projection answered a different question. It used Olink proteomics in a population-based resource, so it contextualized the GNPC axes across platforms rather than directly reproducing the SomaScan subtype analysis.
- Incident dementia risk set: 38,239 participants with 1,311 incident all-cause dementia events.
- Incident Alzheimer’s risk set: 38,269 participants with 693 incident Alzheimer’s disease events.
- Follow-up window: Median follow-up was 11.33 years.
- Main UKB pattern: Platelet, renal, lipid, inflammatory, liver, and other systemic traits were larger and more consistent correlates than cognition, MRI, or incident disease.
In other words, the external data supported a measured biological structure, but not a simple claim that the axes were ready-made Alzheimer’s subtype categories or dementia-risk predictors.
Alzheimer Blood Proteomics Needs Longitudinal Validation
The analysis narrows how plasma proteomic heterogeneity should be discussed. Instead of assigning people to mutually exclusive molecular boxes, the data support a model where individuals can vary along overlapping protein coordinates.
Several limits keep the clinical interpretation narrow:
- Preprint status: The report has not been certified by peer review.
- Discovery-resource overlap: Axis derivation and internal clinical association came from the broad GNPC resource.
- Platform differences: SomaScan and Olink do not measure proteins in identical ways.
- Small imaging subsets: Stanford tau PET and some imaging analyses had limited sample sizes.
- No calibrated clinical score: The axes were not prospectively validated for diagnosis, prognosis, or treatment selection.
The next studies should combine harmonized plasma proteomics with phosphorylated tau, amyloid and tau imaging, neurodegeneration markers, structural MRI, and longitudinal outcomes. Same-platform replication would be especially important.
For now, the clean reading is that Alzheimer’s blood-protein variation was graded. Continuous coordinates may eventually help stratify patients, but this source supports research mapping rather than a new clinical subtype test.
Citation: DOI: 10.64898/2026.07.04.26357296. Park and Le Guen. Plasma proteomics reveals continuous molecular heterogeneity rather than discrete subtypes in Alzheimer’s disease. medRxiv. 2026.
Study Design: Multi-cohort plasma proteomics analysis comparing discrete clustering with continuous molecular axes in Alzheimer’s disease and mild cognitive impairment.
Sample Size: 5,895 unique GNPC AD/MCI participants, with external Stanford ADRC and UK Biobank projection analyses.
Key Statistic: Four continuous axes captured 81.5% of module-space variation, while the stable two-cluster solution had weak separation with silhouette width 0.251.
Caveat: This is preprint-stage evidence, and the axes have not been prospectively calibrated for clinical diagnosis, prognosis, or treatment selection.