TL;DR: A 2026 Molecular Psychiatry study linked blood-derived microRNAs, short RNA regulators that help control gene expression, to left hippocampal volume and later brain atrophy in adults from the Rhineland Study.
Key Findings
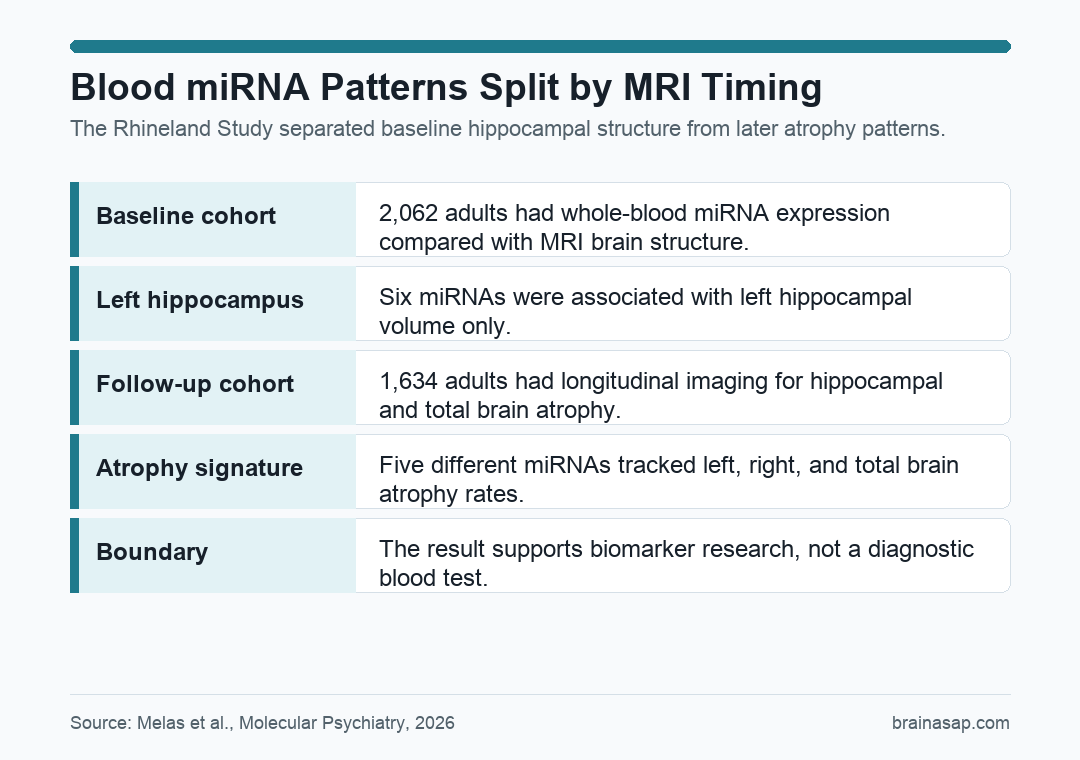
- Baseline MRI cohort: Researchers compared blood microRNA expression in 2,062 adults with baseline MRI measures of left and right hippocampal volume, hippocampal asymmetry, and total brain volume.
- Follow-up MRI cohort: In 1,634 adults, follow-up MRI occurred 4.60 to 8.02 years later, with a median follow-up of 5.52 years.
- Six microRNAs tracked left hippocampal volume: miR-199a-3p, miR-199b-3p, miR-155-5p, miR-146a-5p, miR-6859-5p, and miR-505-5p were linked only to left hippocampal volume in the cross-sectional analysis.
- Five different microRNAs tracked atrophy: miR-361-3p, miR-4473, miR-381-3p, miR-543, and miR-370-3p were associated with left hippocampal, right hippocampal, and total brain atrophy rates.
- Biomarker use remains early: The study highlighted miR-146a-5p and miR-370-3p as dementia-linked candidates, but it does not turn either marker into a diagnostic blood test.
Source: Molecular Psychiatry (2026) | Melas et al.
MicroRNAs (miRNAs) are small RNA molecules that help regulate which genes are translated into proteins. Because one miRNA can influence many target genes, blood miRNA patterns can act as broad readouts of biological state.
The new Rhineland Study analysis asked whether those blood patterns line up with MRI measures of the hippocampus, a memory-related brain structure that is vulnerable in aging and dementia.
Blood miRNAs Were Compared With MRI Brain Measures
The study used data from the Rhineland Study, a population-based cohort in Bonn, Germany. Participants were adults at least 30 years old who completed blood sampling and a detailed imaging protocol.
Researchers measured whole-blood miRNA expression at baseline and used 3 T MRI to measure left hippocampal volume, right hippocampal volume, total brain volume, and hippocampal asymmetry.
The design had two connected parts:
- Cross-sectional analysis: 2,062 participants with baseline blood miRNA and hippocampal imaging data were used to test which miRNAs were associated with brain structure at the same time point.
- Longitudinal analysis: 1,634 participants with follow-up imaging were used to test whether baseline miRNAs were associated with later rates of hippocampal or total brain atrophy.
- Median 5.52-year follow-up: The time between baseline and follow-up visits ranged from 4.60 to 8.02 years, giving the study a real aging window rather than a short repeat scan.
The baseline-versus-follow-up split is important. A miRNA linked to baseline hippocampal size might reflect development, earlier-life biology, or long-standing brain differences.
A miRNA linked to atrophy rate points more directly toward change over time.
Six miRNAs Were Linked Only to Left Hippocampal Volume
The cross-sectional result was lateralized. Six miRNAs were associated with left hippocampal volume, but not with right hippocampal volume or total brain volume after correction for multiple comparisons.
The six-miRNA pattern included miR-199a-3p, miR-199b-3p, miR-155-5p, miR-146a-5p, miR-6859-5p, and miR-505-5p.
Researchers then looked at target-gene patterns to ask what those miRNAs might be connected to biologically. The blood-derived miRNAs from the cross-sectional analysis targeted genes related to:
- Brain development: Gene sets tied to developmental processes appeared in the target-gene analysis.
- Memory biology: The target patterns included genes connected with memory-related function.
- Synapse assembly: Several targets pointed toward how neural connections form or are maintained.
The left-sided result should not be overread as a simple “left hippocampus blood test.” The study treated it as evidence that peripheral miRNA expression may be connected to lateralized hippocampal biology, not as proof of a clinical cutoff.
A Separate miRNA Signature Tracked Brain Atrophy Rate
The longitudinal analysis found a different pattern. Five miRNAs were associated with left hippocampal atrophy, right hippocampal atrophy, and total brain atrophy over time.
Those five were miR-361-3p, miR-4473, miR-381-3p, miR-543, and miR-370-3p. The pattern pointed to a separate aging-related or neurodegeneration-related signature rather than the same signature seen in baseline left hippocampal volume.
The study also found 21 miRNAs associated only with total brain atrophy rate. The broader association suggests blood miRNAs may reflect whole-brain aging processes in addition to hippocampus-specific patterns.
Target-gene analyses for the longitudinal miRNAs pointed toward structural neural processes:
- Axonal growth: The target genes included pathways related to axons, the long projections neurons use to communicate across distance.
- Dendritic growth: The analysis also pointed toward dendrites, the input branches that shape how neurons receive signals.
- Neurodegeneration links: Several identified miRNAs had already been connected to neurodegenerative disease in prior work.
The important point is the split between baseline structure and change over time. The same blood assay did not simply produce one undifferentiated brain-health marker.
miR-146a-5p and miR-370-3p Stood Out for Dementia Relevance
The discussion gave special attention to miR-146a-5p and miR-370-3p because both have been consistently linked to dementia-related biology in earlier studies.
miR-146a-5p appeared in the left-hippocampal-volume signature. The discussion notes that it has been tied to neuroinflammation and Alzheimer-related pathology, although its association with larger hippocampal volume in this dataset needs careful interpretation.
miR-370-3p appeared in the atrophy-rate signature. Its placement in the longitudinal analysis makes it more directly relevant to change over time, because baseline expression was associated with later imaging trajectories rather than only with one baseline MRI measure.
The dementia-biomarker relevance is limited to a research setting: the study connects peripheral RNA markers with measured brain structure. A routine miRNA blood panel still cannot predict dementia from this evidence alone.
The Study Supports Biomarker Research, Not Diagnosis
The biggest strength is scale. The cross-sectional analysis included 2,062 adults, and the longitudinal imaging analysis included 1,634 adults with a median of 5.52 years between scans.
The main limitation is interpretation. Blood miRNAs can reflect immune cells, systemic inflammation, vascular biology, and other peripheral processes.
A blood pattern associated with the hippocampus does not prove the same miRNA is acting inside hippocampal neurons.
- Observational design: The study can identify associations, not prove that any miRNA caused hippocampal change.
- Peripheral blood source: Whole-blood miRNA expression may reflect systemic biology as well as brain-related processes.
- Replication needed: The signatures need testing in other cohorts and in people at higher risk for dementia conversion.
The practical takeaway is specific: blood-derived miRNA signatures were associated with hippocampal structure and later atrophy patterns in a population cohort, with different miRNAs marking baseline structure and longitudinal brain change.
The next dementia-biomarker question is more focused: whether miRNAs such as miR-146a-5p and miR-370-3p can improve early risk prediction when combined with MRI, cognition, genetics, and other blood markers.
Citation: DOI: 10.1038/s41380-026-03611-6. Study authors et al. Melas et al. Blood-derived microRNA signatures associated with hippocampal structure and atrophy rate: findings from the Rhineland Study. Molecular Psychiatry . 2026.
Study Design: Population-based cross-sectional and longitudinal cohort analysis using blood RNA sequencing and 3 T MRI.
Sample Size: 2,062 participants in the baseline imaging analysis and 1,634 participants in the follow-up imaging analysis.
Key Statistic: Six miRNAs were associated only with left hippocampal volume, while five different miRNAs were associated with bilateral hippocampal and total brain atrophy rates.
Caveat: Observational blood-based association study; the miRNA signatures are research candidates, not validated dementia diagnostic tests.