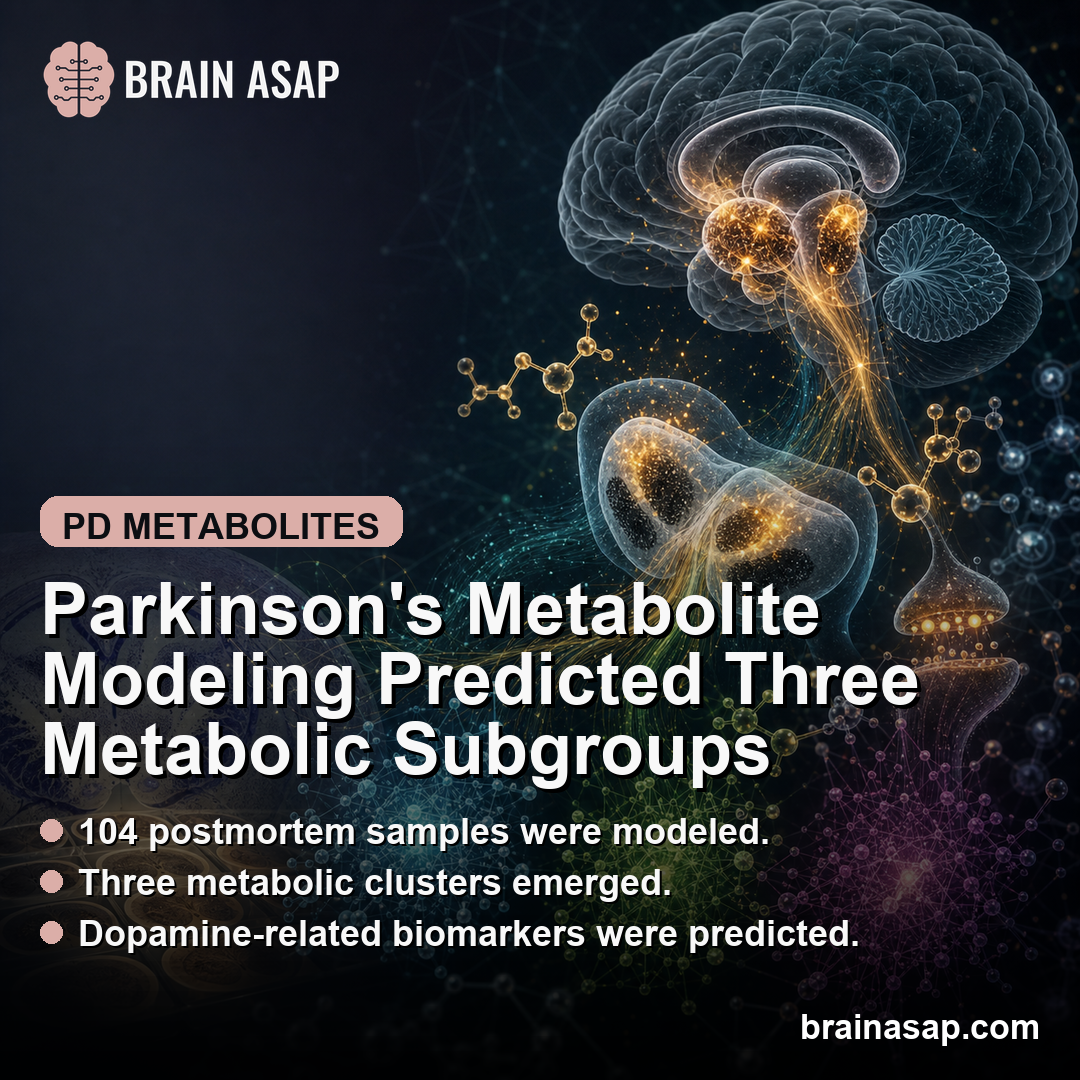
TL;DR: A 2026 npj Parkinson’s Disease study used brain transcriptome data and genome-scale metabolic modeling to predict Parkinson’s metabolite biomarkers, including dopamine-related changes, and separated 104 postmortem samples into three metabolic clusters.
Key Findings
- Metabolic model: The study used TAMBOOR, a transcriptome-based metabolic modeling algorithm, to predict metabolite oversecretion and undersecretion.
- Brain tissue data: The discovery analysis used 104 postmortem Parkinson’s substantia nigra samples across eight datasets.
- Consensus biomarkers: Predicted markers included dopamine, eumelanin, salsolinol, vitamin D3, and retinal.
- Subgroups: The model separated patients into three metabolically distinct clusters of 33, 37, and 34 samples.
- Caution: These were computational predictions from brain tissue data, not a ready clinical blood or spinal-fluid test.
Source: npj Parkinson’s Disease (2026) | Abdik and Cakir
Parkinson’s disease is not one metabolic state. People can share a diagnosis while differing in motor symptoms, sleep disruption, constipation, depression, medication response, pathology, and molecular changes.
Abdik and Cakir approached that heterogeneity from a modeling angle.
The study used gene-expression data from Parkinson’s substantia nigra tissue and mapped it through a genome-scale metabolic model. Instead of asking which genes changed, the analysis asked which metabolites might be oversecreted or undersecreted by each patient-specific model.
Interpretation depends on that distinction. The paper is not claiming that a clinic can measure these predicted metabolites tomorrow and classify every patient.
It proposes a way to connect transcriptomic disruption to individual-level metabolic profiles, then test whether those profiles separate Parkinson’s subgroups.
TAMBOOR Modeled Parkinson’s Metabolite Secretion From Brain Transcriptomes
The algorithm at the center of the paper is called TAMBOOR, short for TrAnscriptome-based Metabolite Biomarkers by On-Off Reactions. It links gene-expression changes to metabolic reactions in a genome-scale model, then predicts whether metabolites are more likely to be oversecreted or undersecreted.
The discovery analysis used 104 postmortem substantia nigra samples from Parkinson’s patients across eight datasets. The substantia nigra is a key Parkinson’s brain region because dopamine-producing neurons degenerate there.
After filtering, the analysis considered hundreds of metabolites for clustering and biomarker prediction. That scale is one reason the model was useful: Parkinson’s biology involves dopamine, mitochondrial function, oxidative stress, lipid metabolism, amino acids, and other pathways that are hard to summarize with one marker.
A single biomarker can be attractive because it is easy to communicate. Parkinson’s disease, however, may require a profile-based approach if different patients reach similar symptoms through different metabolic disturbances.
Consensus Parkinson’s Biomarkers Included Dopamine and Eumelanin
The consensus biomarker analysis identified metabolites predicted to shift across many patient models. Some were expected.
Dopamine appeared in the consensus list, which fits the central dopamine deficit in Parkinson’s disease. Eumelanin, a pigment related to neuromelanin biology, also fit the disease context.
Other predicted metabolites, including salsolinol, vitamin D3, and retinal, point to broader biochemical pathways. Salsolinol has been discussed in dopamine-related neurotoxicity.
Vitamin D and retinal connect to immune, metabolic, and visual-retinoid biology, although the paper does not turn those predictions into treatment recommendations.
The consensus approach produced 150 predicted biomarkers, with 49 oversecretion and 101 undersecretion predictions. That directionality is important because a biomarker list without direction is less informative than a model that predicts whether a metabolite is elevated or reduced.
- Known disease biology: Dopamine and eumelanin fit established Parkinson’s pathways.
- Candidate extensions: Salsolinol, vitamin D3, and retinal point to additional pathways for follow-up testing.
- Directionality: The model separated oversecretion predictions from undersecretion predictions.
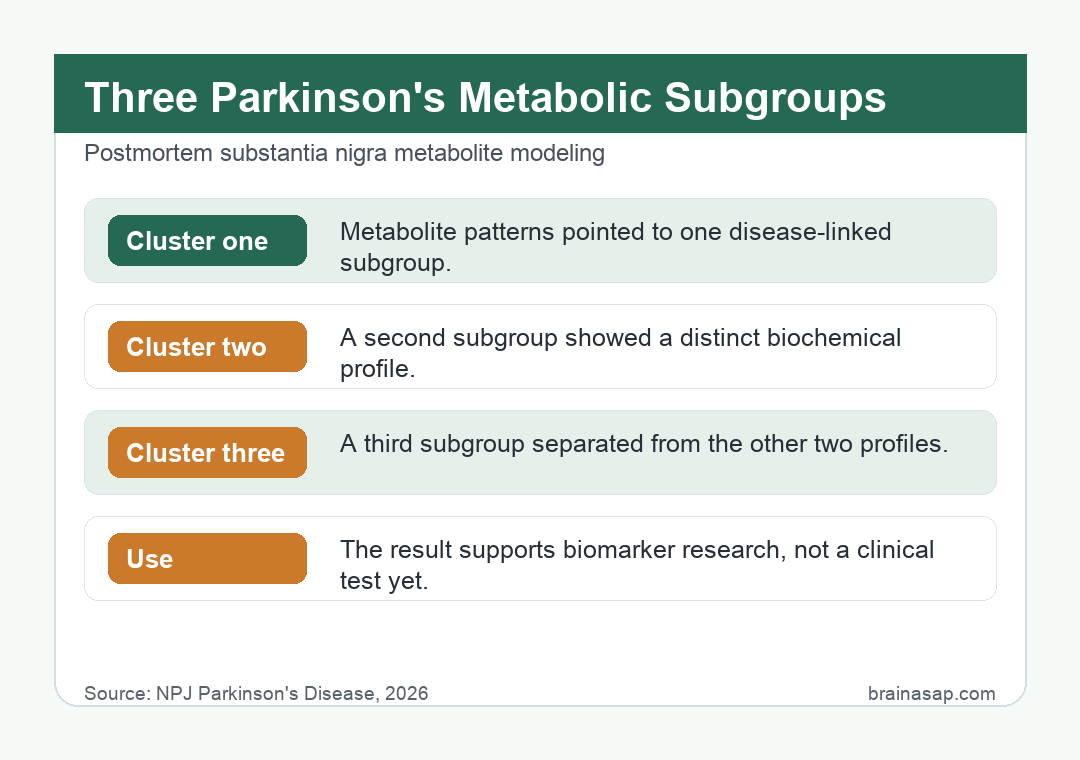
Three Metabolic Parkinson’s Clusters Had Different Predicted Profiles
The clustering analysis separated the 104 Parkinson’s samples into three groups: 33, 37, and 34 samples. The question was not simply how many groups could be produced.
The stronger test was whether metabolite predictions differed enough across patients to support subgroup analysis.
- Cluster 1: 33 Parkinson’s samples with one predicted secretion profile.
- Cluster 2: 37 samples with a second metabolic pattern.
- Cluster 3: 34 samples with a third predicted profile.
A random-forest analysis identified 100 metabolites that helped discriminate the clusters. Of those, 57 overlapped with the broader candidate biomarker set.
That overlap suggests the subgroups were not arbitrary mathematical partitions; they were related to the metabolites most connected to Parkinson’s metabolic disruption in the model.
Some metabolites were subgroup-specific rather than consensus markers. Melatonin and biliverdin are examples.
They did not define the whole Parkinson’s group in the same way as the consensus approach, but they showed distinct predicted secretion patterns across clusters.
That is the practical advantage of clustering. A consensus marker can describe the disease overall, while a cluster-specific marker can identify a subgroup that may otherwise be hidden inside the average Parkinson’s profile.
Validation Data Supported the Cluster Structure but Not Clinical Readiness
The paper also tested the model in a separate living-brain prefrontal cortex dataset with 81 Parkinson’s samples. A substantial subset of the predicted biomarkers was reproduced in that validation context, and the model assigned validation samples across the three clusters.
The validation step is valuable because it reduces the chance that the three-cluster structure came only from one postmortem substantia nigra dataset. Still, validation within transcriptome-driven modeling is not the same as direct biochemical confirmation in patients.
A clinical biomarker would need repeated measurement in accessible samples, such as blood, cerebrospinal fluid, or imaging-linked readouts. It would also need to predict something clinically meaningful, such as progression, symptoms, treatment response, or diagnosis against a relevant comparison group.
The validation dataset came from a different brain region, which is both helpful and limited. Reproduction across data contexts supports the general modeling structure, but Parkinson’s-relevant metabolism can differ by region, disease stage, cell composition, and postmortem handling.
The paper also reported that many validation samples kept compatible cluster assignments when discovery and validation data were considered together. That supports the idea that the clusters captured recurring metabolic structure rather than one accidental split in a single dataset.
The computational nature also affects how negative findings should be read. If a metabolite was not predicted as a consensus marker, it may still matter in a subset of patients, a different brain region, or a different disease stage.
The model is a prioritization tool, not a complete inventory of Parkinson’s metabolism.
Modeling Predictions Still Need Direct Biomarker Validation
The strongest way to read this paper is as a hypothesis-generating metabolic map. It names candidate metabolites and patient subgroups that can now be tested with targeted metabolomics, longitudinal samples, and clinical data.
The main limits are clear:
- Tissue source: The discovery data came from postmortem brain tissue, not living clinical samples.
- Prediction layer: TAMBOOR infers secretion patterns from transcriptomes and metabolic models rather than directly measuring every metabolite.
- Clinical endpoint: The clusters still need links to symptoms, progression, and treatment response.
That restraint is part of the value. Parkinson’s heterogeneity is one reason broad diagnostic and treatment strategies can feel imprecise.
A metabolite-based subgroup model gives researchers a more testable structure: predicted consensus biomarkers for the disease overall, plus cluster-specific molecules that may explain why patients differ.
The next step is direct measurement. Targeted metabolomics could test whether dopamine-related, melatonin-related, biliverdin-related, vitamin D, or retinal patterns appear in accessible samples and whether they map onto symptoms or progression.
If that work succeeds, this kind of model could help move Parkinson’s biomarker research away from a single average patient. It would still need careful validation, but the paper gives a concrete list of molecules and subgroups to test.
Citation: DOI: 10.1038/s41531-026-01337-4; Abdik E, Cakir T; Personalized metabolite biomarker predictions reveal heterogeneous characteristics of Parkinson’s disease; npj Parkinson’s Disease; 2026.
Study Design: Computational metabolite-biomarker prediction using genome-scale metabolic modeling, Parkinson’s brain transcriptome datasets, clustering, and validation in an independent transcriptome dataset.
Sample Size: Discovery analysis used 104 postmortem substantia nigra Parkinson’s samples across eight datasets; validation used 81 Parkinson’s samples from living-brain prefrontal cortex data.
Key Statistic: The model separated 104 Parkinson’s samples into three metabolic clusters of 33, 37, and 34 samples.
Caveat: The biomarkers and clusters are computational predictions from transcriptome data and still need direct biochemical and clinical validation.