TL;DR: A 2026 study in npj Mental Health Research found that a 308-person multimodal MRI study found treatment-resistant depression carried a distinct structure-function decoupling pattern, and machine-learning models separated TRD from non-resistant depression with AUCs up to 0.95.
Key Findings
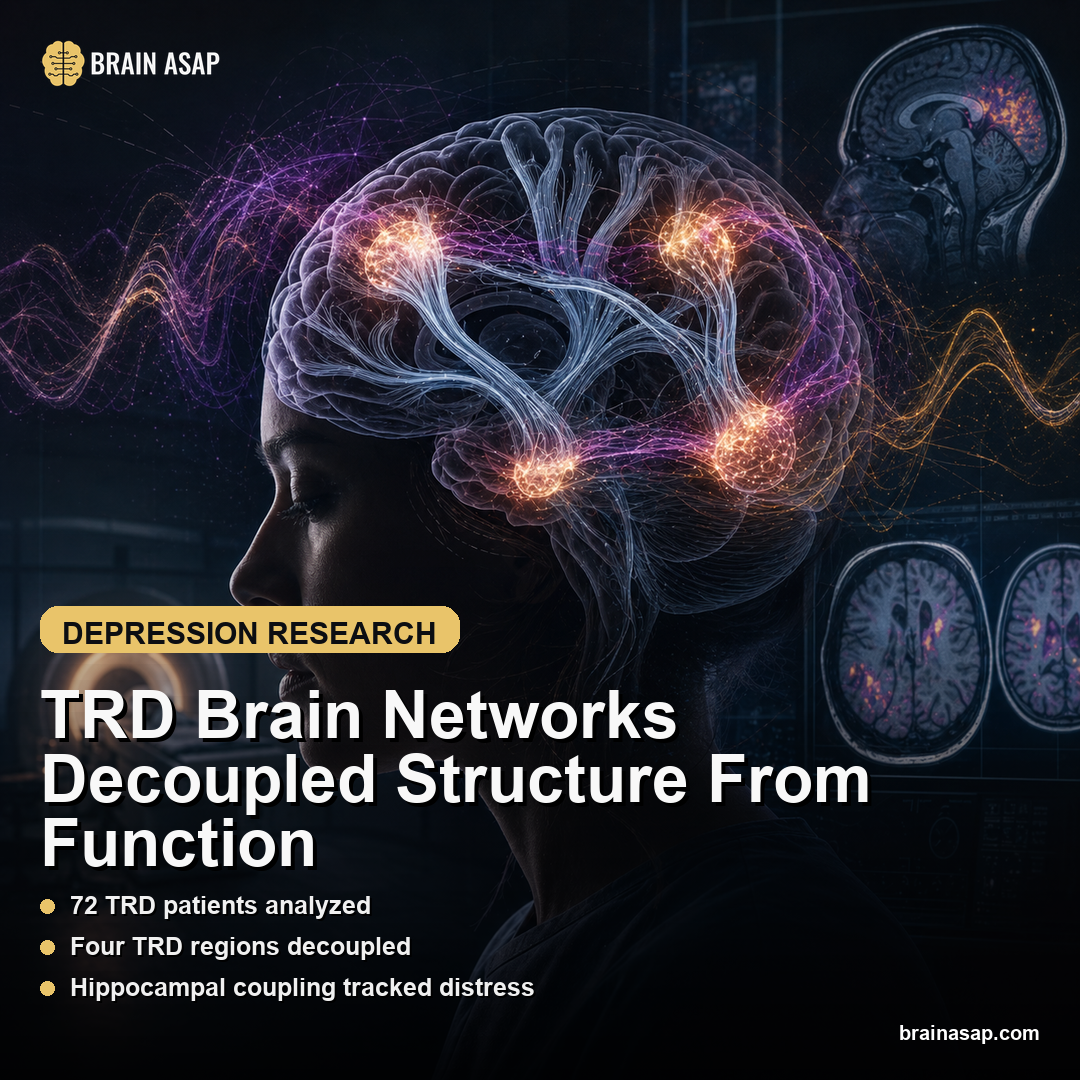
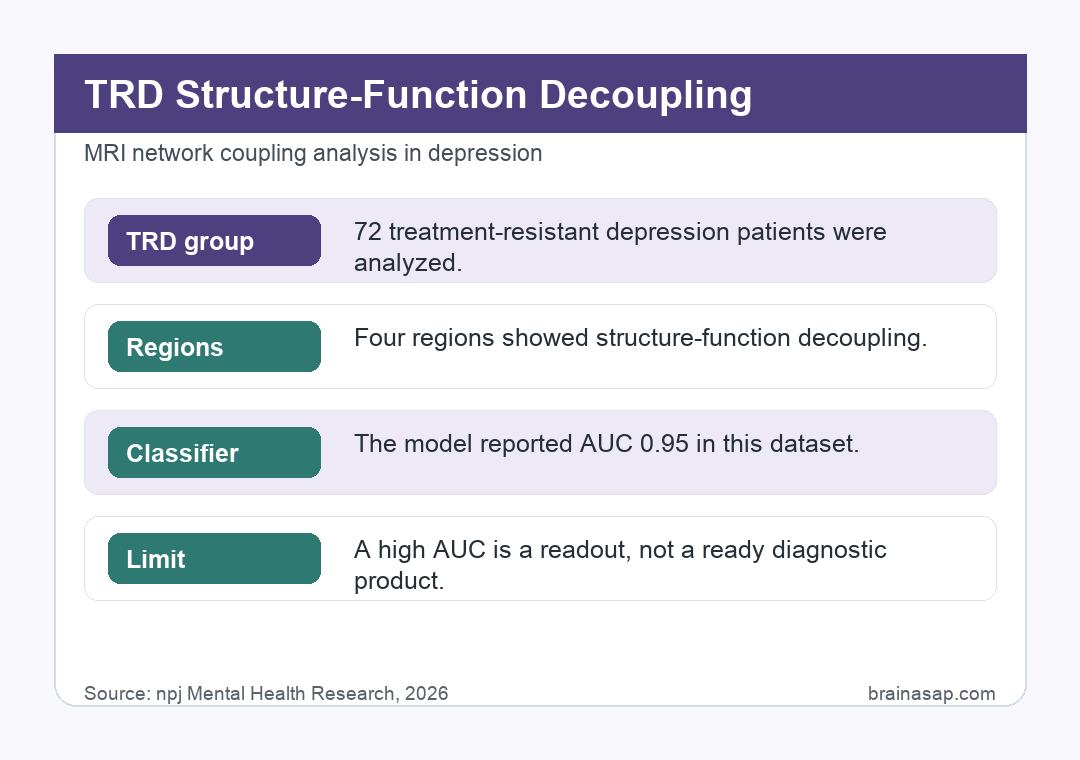
- 72 TRD patients analyzed: The final sample included 72 patients with treatment-resistant depression, 152 with non-treatment-resistant depression, and 84 healthy controls.
- Four TRD regions decoupled: TRD patients showed altered structure-function coupling in the right middle frontal gyrus, left inferior parietal lobule, left precentral gyrus, and right superior temporal gyrus.
- Hippocampal coupling tracked distress: In non-resistant depression, higher left rostral hippocampal SFC correlated with suicidal ideation and despair, including a reported BSI correlation of r = 0.329.
- Machine learning separated TRD: SFC-based models distinguished TRD from non-resistant depression with AUC values of 0.886 to 0.950 in one atlas and 0.923 to 0.929 in another.
- TRD stayed symptomatic after treatment: The TRD group averaged HAMD-24 scores of 31.28 before treatment and 25.68 after treatment, while the non-resistant group dropped from 30.96 to 6.11.
Source: npj Mental Health Research (2026) | Ye et al.
Depression becomes clinically cruel when the diagnosis stays the same but the treatment response disappears.
In this study, treatment-resistant depression was not simply more severe depression on a questionnaire.
It was a different coordination problem between the brain’s wiring and its moment-to-moment activity.
Why TRD Needs More Than a Symptom Checklist
Treatment-resistant depression is usually defined by failure: at least two adequate antidepressant trials that did not produce enough improvement.
Study details: That definition is clinically helpful, but biologically blunt.
It tells a doctor what already went wrong, not why the next treatment might work. Ye and other researchers approached TRD as a brain coordination problem.
They asked whether patients whose depression resisted treatment show a distinct mismatch between structural connectivity, the anatomy of communication pathways, and functional connectivity, the activity patterns those pathways support.
The concept is called structure-function coupling.
When coupling is high, functional activity patterns closely follow the brain’s structural architecture.
When coupling breaks down, the brain’s activity becomes less constrained by its wiring, which can mean flexibility in some contexts and dysregulation in others.
How 308 MRI Scans Tested Structure-Function Coupling
The final dataset included 72 patients with TRD, 152 patients with non-treatment-resistant depression, and 84 healthy controls.
All participants were right-handed Han Chinese adults recruited from Zhejiang University-affiliated clinical settings or the local community.
The researchers combined structural MRI and resting-state functional MRI. For each brain region, they computed a structure-function coupling value, then tested group differences, symptom associations, and machine-learning classification.
Most depression imaging studies examine structure or function separately, even though real brains do not operate in separate columns.
A coupling measure asks whether anatomy and ongoing activity still line up in clinically meaningful ways.
The TRD and non-resistant depression groups started with similar depression severity.
Their trajectories diverged after treatment: the non-resistant group fell from a mean HAMD-24 score of 30.96 to 6.11, while the TRD group stayed high, moving from 31.28 to 25.68.
The imaging test was whether that clinical difference had a measurable neural signature.
Four Brain Regions Carried the TRD Decoupling readout
The strongest TRD pattern was regional decoupling in the right middle frontal gyrus, left inferior parietal lobule, left precentral gyrus, and right superior temporal gyrus.
Those regions are not random.
They sit across executive control, sensorimotor, attention, and temporal association systems, all of which can matter when depression becomes cognitively sticky and behaviorally hard to shift.
The right middle frontal gyrus is especially relevant because it overlaps with the broader dorsolateral prefrontal control system, a major target in depression neurostimulation.
If structure and function are poorly coordinated there, it can help explain why some patients do not respond to ordinary medication trials and why stimulation targeting has become so important.
The study does not prove that decoupling causes treatment resistance. The design is observational, and researchers are careful about that.
The mechanism still has a plausible shape. Frontal, parietal, sensorimotor, and temporal circuits help coordinate control, attention, movement readiness, and social-emotional processing.
If structural wiring and functional activity stop lining up across those systems, TRD appears less like a more intense version of non-resistant depression and more like a distinct network-level failure of coordination.
Hippocampal Coupling Shifted in Non-Resistant Depression
One subtle result makes the paper more informative.
Across all patients, symptom correlations were not strong.
But when the researchers separated the groups, higher structure-function coupling in the left rostral hippocampus correlated with suicidal ideation and despair in the non-resistant depression group.
The reported BSI correlation was r = 0.329 with p = 0.026.
That is not a giant effect, but it points toward an important possibility: the same MRI feature can mean different things depending on whether depression is treatment-resistant.
In non-resistant depression, hippocampal-limbic coupling tracked acute distress. In TRD, the key readout moved elsewhere, into broader frontoparietal and temporal decoupling.
The difference is important for biomarker research.
A depression biomarker that averages TRD and non-TRD together can erase the pattern clinicians actually need.
The helpful test is not “does this feature correlate with depression?” It is “which depression subgroup does this feature identify?”
- TRD readout: decoupling appeared in frontal, parietal, precentral, and superior temporal regions.
- Non-resistant readout: rostral hippocampal coupling tracked suicidal ideation and despair.
- Biomarker risk: pooling depression subtypes can hide clinically helpful differences.
AUC 0.95 Is a readout, Not a Diagnostic Product
The machine-learning results were strong.
Using altered regional SFC features, models separated TRD from non-resistant depression with AUC values ranging from 0.886 to 0.950 in the BNA atlas and 0.923 to 0.929 in the Harvard-Oxford atlas.
That cross-atlas consistency is encouraging because it suggests the finding is not entirely dependent on one brain parcellation scheme.
Still, an AUC near 0.95 in a single study should be treated as a research readout, not a ready-made clinical test.
Researchers note the need for larger samples and further validation.
There are other caveats.
The sample came from one broad population context, the groups became sex-mismatched after data exclusion, and the study was not designed to prove that structure-function decoupling precedes treatment resistance.
Longitudinal studies will need to test whether the decoupling pattern predicts future nonresponse before repeated medication failures accumulate.
The mechanism test is timing.
If decoupling is present before treatment, it could help identify patients who need faster escalation.
If it appears after repeated episodes or failed trials, it may be a scar of illness burden, medication history, or chronic stress physiology.
Both possibilities matter clinically, but they lead to different uses. A pre-treatment marker supports triage; a later-emerging marker helps explain why entrenched depression becomes harder to shift.
How This Could Change TRD Screening
The most practical future use is earlier triage.
Today, TRD is often recognized only after patients spend months or years trying treatments that do not work.
A reliable imaging biomarker can help identify patients who need faster escalation to neurostimulation, ketamine/esketamine, combination strategies, or more intensive care.
This paper does not deliver that tool yet.
But it names a plausible biomarker class: regional structure-function coupling, especially in frontal, parietal, precentral, and superior temporal regions.
That is more informative than searching for a single “depression region” and hoping it explains treatment failure.
Resistant depression requires multimodal biomarkers because the brain’s anatomical wiring and functional rhythms each tell only part of the explanation.
In this dataset, TRD showed up most clearly in the gap between them.
The clinical test would need to prove added value over symptom severity, episode history, medication exposure, trauma load, sleep disruption, and comorbid anxiety.
Otherwise, the MRI model may be impressive without changing decisions.
The strong version of the claim is narrower and better: structure-function coupling can help define a TRD neurophenotype, especially if future studies show that the same decoupling pattern predicts nonresponse before another failed treatment trial.
The structure-function coupling result separates three practical claims:
- TRD pattern: Resistant depression showed regional decoupling across frontal, parietal, precentral, and temporal regions.
- Non-resistant pattern: Rostral hippocampal coupling tracked suicidal ideation and despair in the non-resistant group.
- Clinical limit: The MRI model needs validation before it can guide treatment escalation.
Citation: DOI: 10.1038/s44184-026-00206-5. Ye et al. Impaired regional structure-function coupling as novel neurophenotype: mechanistic insights and diagnostic exploration in treatment-resistant depression. npj Mental Health Research. 2026;5:27
Study Design: Cross-sectional multimodal MRI study with regional structure-function coupling analysis and machine-learning classification.
Sample/Model: 72 TRD patients, 152 non-treatment-resistant depression patients, and 84 healthy controls.
Key Statistic: Structure-function coupling models distinguished TRD from non-resistant depression with AUC values up to 0.950.
Caveat: Single-study evidence; interpret with the source design and sample.