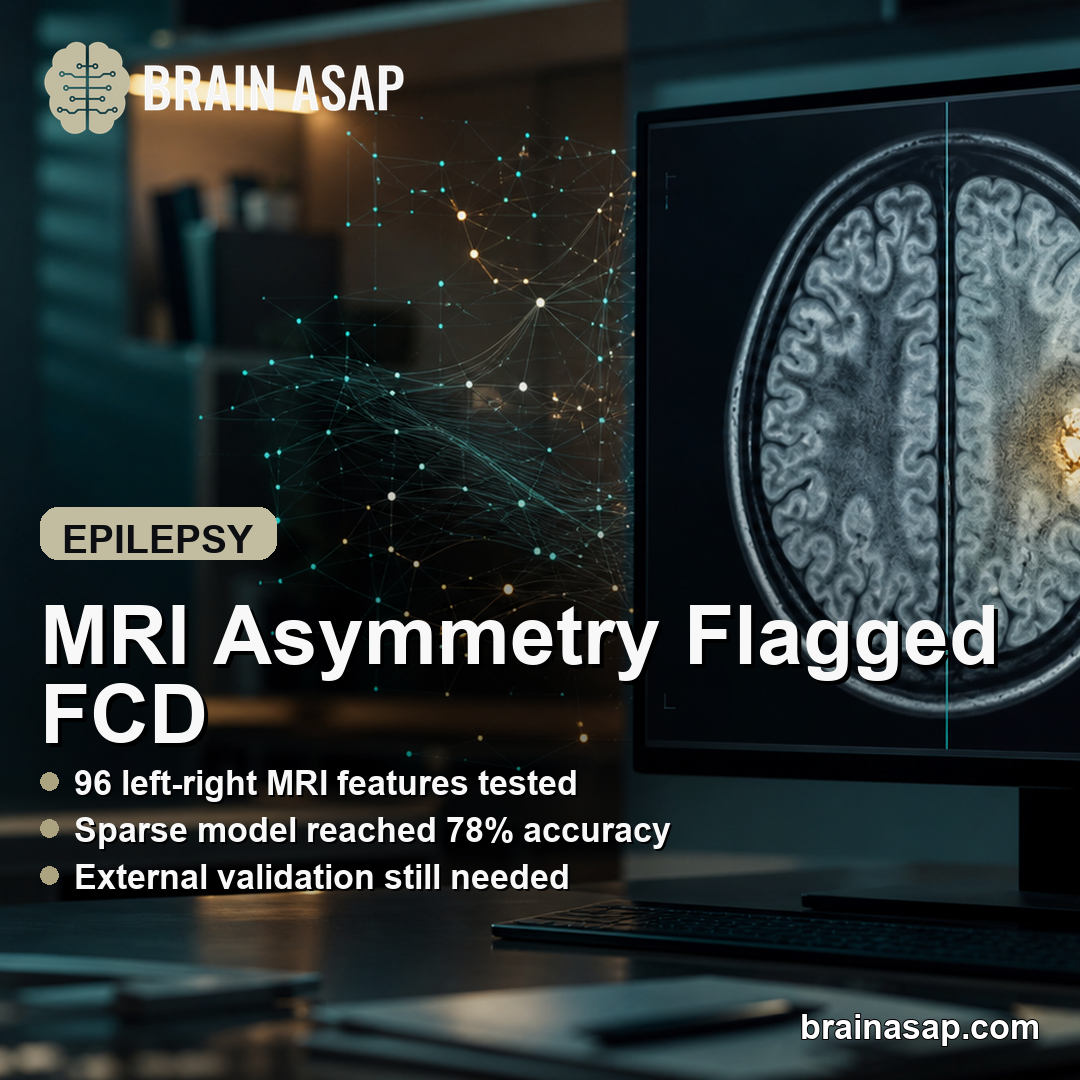
TL;DR: A 2026 preprint in medRxiv tested an interpretable machine-learning model for focal cortical dysplasia (FCD), a lesion linked to drug-resistant epilepsy, and found that hemispheric-asymmetry MRI features classified 39 of 50 subjects correctly in leave-one-out testing.
Key Findings
- 50-subject MRI sample: The analysis used 25 FCD patients and 25 age-matched healthy controls from the public Bonn FCD structural MRI dataset.
- 96 asymmetry features: Researchers extracted mean-intensity and intensity-dispersion asymmetry indices across 48 homologous cortical region pairs.
- 78% best accuracy: L1-regularized logistic regression correctly classified 39 of 50 subjects under leave-one-out cross-validation.
- Permutation p=0.02: The best classifier exceeded a label-permutation null distribution whose mean accuracy was 51.9%.
- 21 retained features: The sparse model selected 21 of 96 features, with large contributions in inferior/middle frontal and temporal regions.
Source: medRxiv (2026) | Dang and Iraqui
Focal Cortical Dysplasia Is Often Subtle on MRI
Focal cortical dysplasia (FCD) is an abnormal area of cortical development and a major cause of drug-resistant focal epilepsy. For some patients, surgical removal of the seizure-generating tissue can offer the best chance of seizure freedom.
The challenge is localization. FCD can appear as subtle cortical thickening, blurred gray-white boundaries, small MRI-intensity changes, or abnormal symmetry between hemispheres.
Those changes can be difficult to spot on routine structural MRI. The preprint notes prior benchmark work on the same dataset in which experienced neuroradiologists identified FCD lesions in 68% of confirmed cases.
The asymmetry approach starts from a practical clinical radiology idea: a focal dysplasia is usually unilateral, so the opposite hemisphere can provide a built-in comparison. That does not remove the need for clinical judgment, but it turns a familiar visual heuristic into measurable regional features.
Hemispheric Asymmetry Was Turned Into 96 MRI Features
The analysis used a subset of the Bonn FCD dataset, a public MRI cohort with confirmed FCD cases and age-matched controls. The selected sample included 25 FCD patients and 25 healthy controls.
Researchers registered each T1-weighted scan to a common template, divided the Harvard-Oxford cortical atlas into left and right components, and measured asymmetry across 48 cortical region pairs.
- Mean intensity asymmetry: The model compared average MRI intensity between homologous left and right regions.
- Intensity-dispersion asymmetry: It also compared the standard deviation of voxel intensities inside each region.
- Normalized left-right index: Each measure used an L-R over L+R formula, producing values bounded between -1 and 1.
Combining those measures created a 96-feature vector for each subject. That feature count was nearly twice the number of participants, so the analysis deliberately favored constrained, interpretable classifiers over more flexible models.
L1 Logistic Regression Beat Three Other Classifiers
Four classifiers were tested with leave-one-out cross-validation: random forest, gradient boosted trees, L1-regularized logistic regression, and a linear support vector machine.
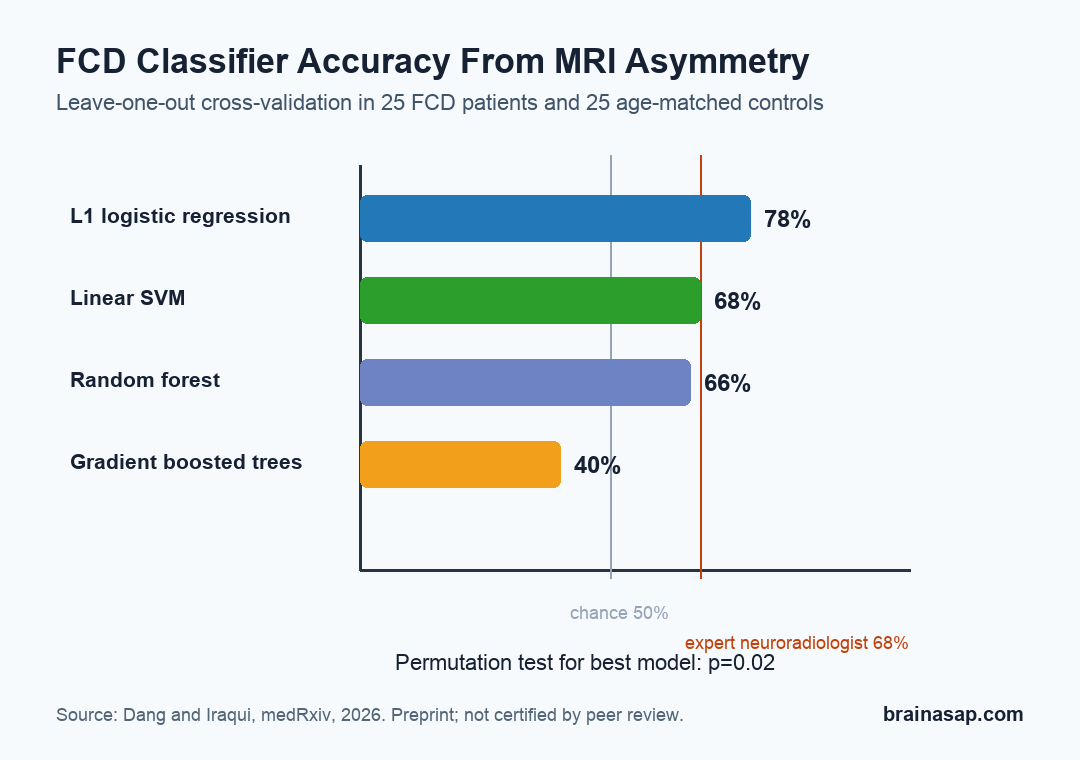
The best result came from L1-regularized logistic regression, which correctly classified 39 of 50 subjects, or 78.0% accuracy. A linear support vector machine reached 68.0%, random forest reached 66.0%, and gradient boosted trees reached 40.0%.
The ordering was clinically and statistically useful because the more flexible model performed worst. In a small dataset with many features, the constrained linear models appeared less likely to chase sample-specific noise.
Permutation Testing Supported the 78% Accuracy Result
Accuracy alone can mislead when the feature count is high and the sample is small. To test whether the best model exceeded chance, the researchers randomly permuted diagnostic labels 100 times and reran the full cross-validation procedure.
The null distribution centered near chance, with mean accuracy of 51.9% and standard deviation of 12.2%. The observed 78.0% result exceeded all but two permuted accuracies, giving p=0.02.
That does not make the model clinically ready. It does show that the observed classification result was unlikely to come only from balanced-label chance performance in this specific sample.
Frontal and Temporal Features Matched Known FCD Anatomy
One reason to use L1 logistic regression is that it can set unhelpful coefficients to zero. In this study, the model retained 21 of 96 features.
The largest selected features involved regions that make anatomical sense for FCD:
- Inferior frontal gyrus: The pars triangularis intensity-dispersion feature had the largest positive coefficient.
- Temporal pole: Another large positive coefficient came from temporal-pole signal dispersion.
- Middle frontal and temporal regions: Additional retained features involved middle frontal gyrus, superior temporal gyrus, and middle temporal gyrus.
Several selected regions were less clearly tied to FCD, including occipital and medial cortical areas. Those selections should be treated cautiously because sparse models can still pick sample-specific features in small datasets.
Clinical Use Would Need Larger Validation and Added MRI Sequences
The strongest interpretation is narrow: hemispheric asymmetry contains measurable information about FCD, and a simple transparent model can recover some of it. The study is not a replacement for radiology review or established multi-site lesion-detection systems.
The limitations were substantial:
- Small single-dataset sample: Only 50 subjects were analyzed, so accuracy and selected features need independent validation.
- No external hold-out: Leave-one-out cross-validation used all subjects across repeated training/test splits, but no outside cohort tested generalization.
- Potential confounders: Sex, handedness, acquisition protocol, scanner factors, and total brain volume were not fully controlled.
- T1-only features: The analysis did not use fluid-attenuated inversion recovery (FLAIR) MRI, even though FLAIR can make FCD lesions more visible.
A transparent baseline could still be useful. If larger datasets confirm the finding, asymmetry-based models could help direct radiologists’ attention to specific cortical regions rather than returning a black-box label.
Citation: DOI: 10.64898/2026.07.02.26357180. Dang HN, Iraqui A. Hemispheric Asymmetry Features and Interpretable Machine Learning for Focal Cortical Dysplasia Classification in Drug-Resistant Epilepsy. medRxiv. 2026.
Study Design: Exploratory preprint analysis of template-normalized structural MRI using hemispheric-asymmetry features and leave-one-out classifier testing.
Sample Size: 50 subjects: 25 focal cortical dysplasia patients and 25 age-matched healthy controls.
Key Statistic: L1-regularized logistic regression reached 78.0% accuracy, correctly classifying 39 of 50 subjects, with permutation p=0.02.
Caveat: This is a non-peer-reviewed preprint using a small single-dataset sample, no external validation cohort, and T1-weighted MRI features only.